Let’s have a more detailed look at foreclosure activity for October in King, Snohomish, and Pierce counties. First up, the Notice of Trustee Sale summary:
October 2009
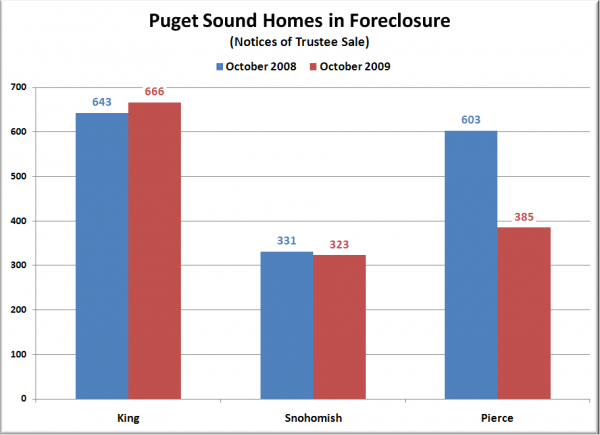
King: 666 NTS, up 4% YOY
Snohomish: 323 NTS, down 2% YOY
Pierce: 385 NTS, down 36% YOY
Foreclosure notices dipped a bit in all three counties last month. Unfortunately the foreclosure rate seems to historically be an extremely noisy measure, alternating up and down month-to-month nearly every month, so we can’t really read much into this particular one-month dip. And, thanks to SB 5810 (more on that here), the year-over-year numbers aren’t particularly useful right now, either..
Here’s a simple look at how October’s foreclosures compare to the same month last year in each of the three counties:
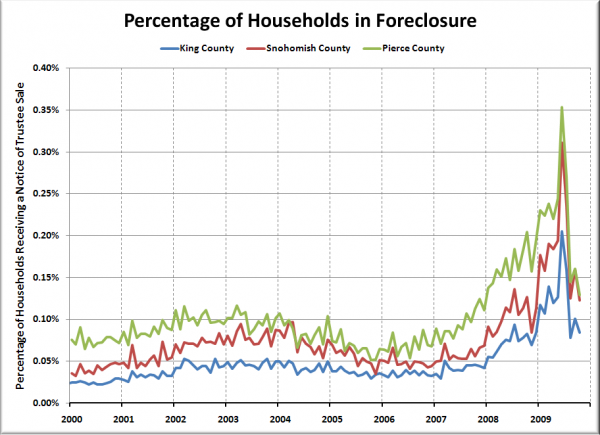
Next let’s look at the percentage of households that received a Notice of Trustee Sale (based on household data for each county from the American Community Survey, assuming linear household growth between surveys):
King County came in at 1 NTS per 1,185 households, Snohomish County had 1 NTS per 816 households, and Pierce had 1 NTS for every 774 households (higher is better).
According to foreclosure tracking company RealtyTrac, Washington’s statewide foreclosure rate of one foreclosure for every 822 households was 29rd worst among the 50 states and the District of Columbia (down from 23rd last month, possibly still due to SB 5810). Note that RealtyTrac’s definition of “in foreclosure” is much broader than what we are using, and includes Notice of Default, Lis Pendens, Notice of Trustee Sale, and Real Estate Owned.
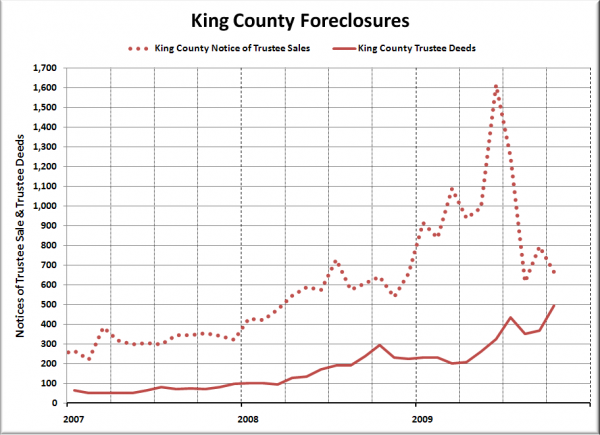
Here’s a look at King County’s Notices of Trustee Sales along with Trustee Deeds (which represent one way that a bank can actually complete the foreclosure process and repossess a house).
496 Trustee Deeds in King County set a new record, and was higher than the volume of Notices of Trustee Sales seen anytime prior to Q2 2008.
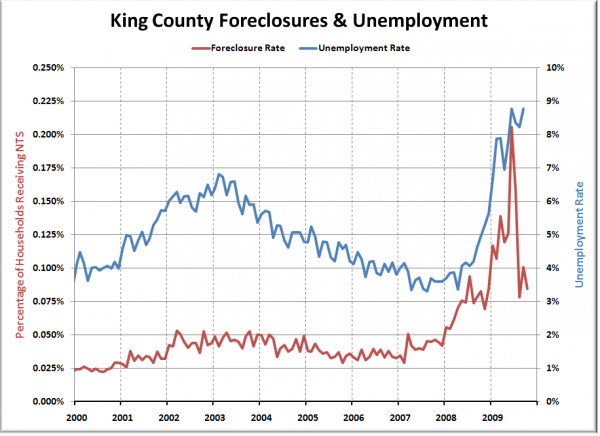
In case you’re curious, here’s one reason that I believe the current downtick in foreclosures is the result of the state legislation rather than an underlying fundamental trend of easing pressure on mortgage holders:
Since 2000, the unemployment rate and the foreclosure rate have tracked fairly close to each other. It seems doubtful that we will see a significant reduction in the rate of distressed mortgage holders while still experiencing a rising unemployment rate.
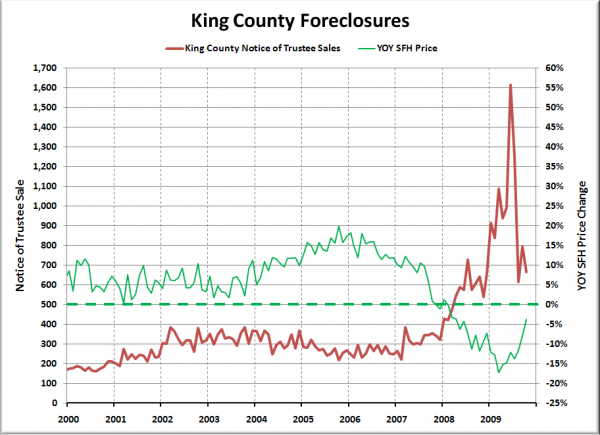
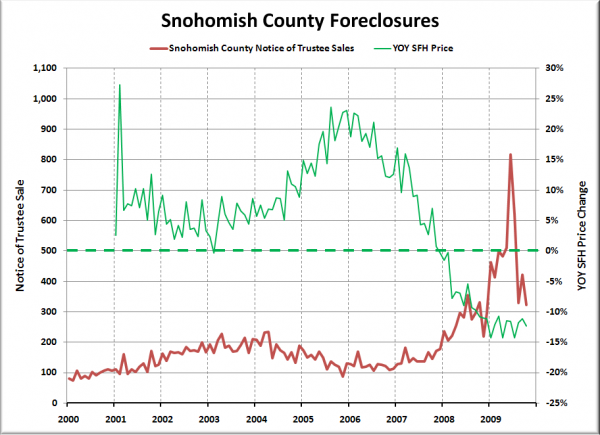
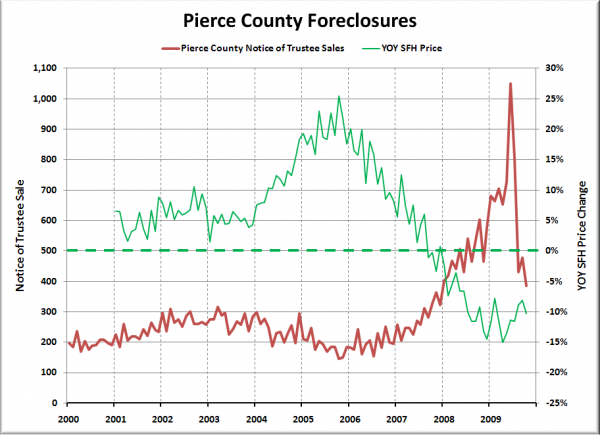
Following are the usual charts of King, Pierce, and Snohomish County foreclosures from January 2000 through October 2009. Click below to continue…
Only July of last year was higher than October’s reading of 666.
July and October of last year came in higher than October of this year in Snohomish.
Pierce County actually dropped below the levels set in every single month of 2008.
Note: The graphs above are derived from monthly Notice of Trustee Sale counts gathered at King, Snohomish, and Pierce County records. For a longer-term picture of King County foreclosures back to 1979, refer to the final chart in this post. For the full legal definition of what a Notice of Trustee Sale is and how it fits into the foreclosure process, check out RCW 61.24.040. The short version is that it is the notice sent to delinquent borrowers that their home will be repossessed in 90 days.
