November market stats have been published by the NWMLS. Here’s their press release: November’s home sales rose modest 2 percent, surprising some Northwest MLS Brokers.
Northwest Multiple Listing Service members recorded a few pleasant surprises last month. Pending sales during November outgained the same month a year ago, marking the first year-over-year increase since April, when the tax credits expired.
Also noted as encouraging were an upswing in relocation sales, shrinkage in the number of new listings added to inventory, and a year-to-date volume of closed sales that is outpacing 2009.
Northwest MLS director OB Jacobi described last month’s gain in the number of transactions written as “surprising.” “That’s surprising, since November is typically one of the slowest sales months of the year, and this year we essentially lost a week to poor weather conditions.” Jacobi, the general manager at Windermere Real Estate Company, also reported increased activity at open houses last month.
Jacobi suggested the increase in sales was due in part to an uptick in interest rates that motivated some buyers to move forward, combined with a desire for people to be in their new homes before the holidays.
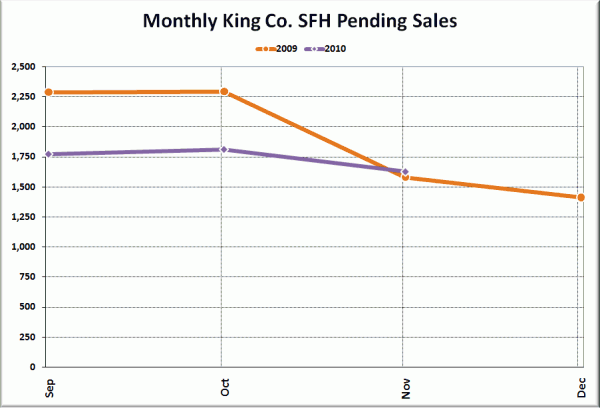
The only way that this moderate year-over-year gain in pending sales would surprise anyone is if they weren’t paying any attention at all to pending sales last year. For those who need a quick refresher, last November, pending sales fell 36% year-over-year and 31% MOM, thanks to the original expiration of the homebuyer tax credit, which had a November 30 cutoff for closed sales. In other words, this month’s YOY “increase” in pending sales represents only the extreme weakness of November 2009, not any sort of strength of November 2010.
Here’s the same explanation in simple chart form:
The 10.1% month-to-month drop in pending sales between October and November this year was slightly less than the average drop between 2000-2008 of 13.7%, but there’s not enough of a difference there that it makes sense to interpret it as some sort of signal of recovering sales.
NWMLS monthly reports include an undisclosed and varying number of
sales from previous months in their pending and closed sales statistics.
Here’s your King County SFH summary, with the arrows to show whether the year-over-year direction of each indicator is favorable or unfavorable news for buyers and sellers (green = favorable, red = unfavorable):
| November 2010 | Number | MOM | YOY | Buyers | Sellers |
|---|---|---|---|---|---|
| Active Listings | 8,722 | -9.8% | +6.1% |  |
 |
| Closed Sales | 1,092 | -16.6% | -30.6% |  |
 |
| SAAS (?) | 2.06 | +1.1% | +39.4% |  |
 |
| Pending Sales | 1,628 | -10.1% | +3.0% |  |
 |
| Months of Supply | 5.36 | +0.3% | +3.1% |  |
 |
| Median Price* | $359,950 | -4.0% | -2.7% |  |
 |
Feel free to download the updated Seattle Bubble Spreadsheet (Excel 2003 format), but keep in mind the caution above.
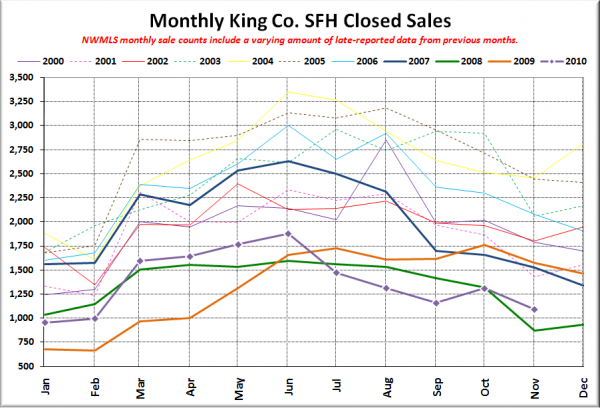
Here’s your closed sales yearly comparison chart:
Hey, we managed to get back above 2008. Barely.
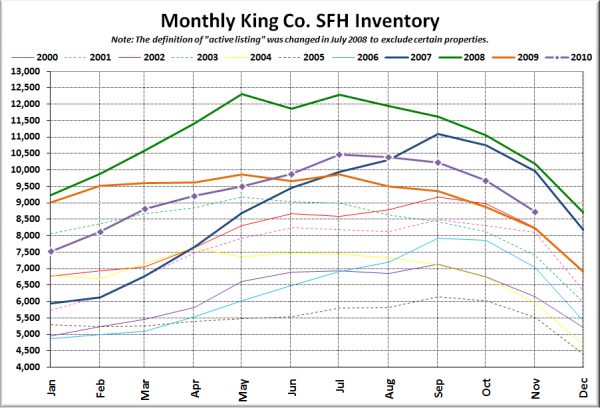
Here’s the graph of inventory with each year overlaid on the same chart.
Nothing much new with inventory. Tracking the usual seasonal pattern, lower than 2007 and 2008, but higher than every other year.
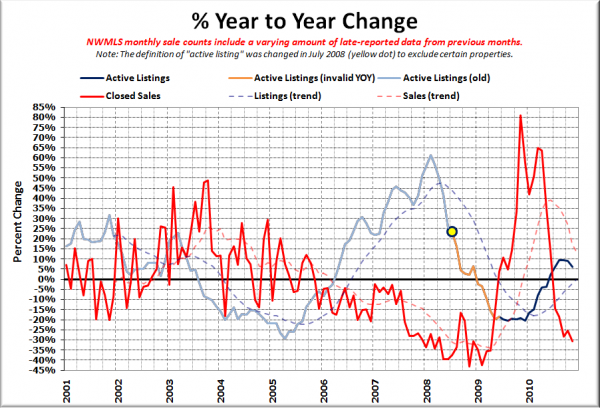
Here’s the supply/demand YOY graph. In place of the now-unreliable measure of pending sales, the “demand” in this chart is represented by closed sales, which have had a consistent definition throughout the decade.
Sales continue to fall faster every month, but the growth in inventory slowed slightly.
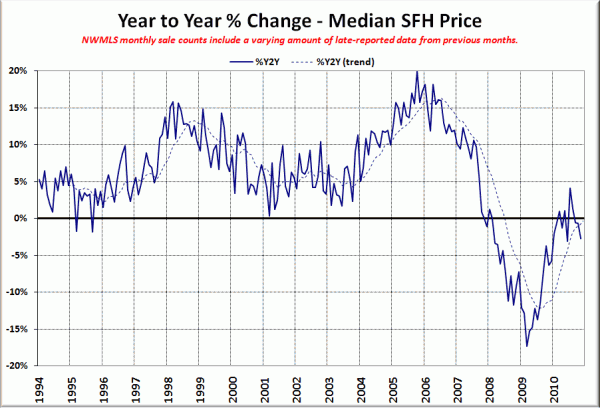
Here’s the median home price YOY change graph:
Oops, dropping back further below zero.
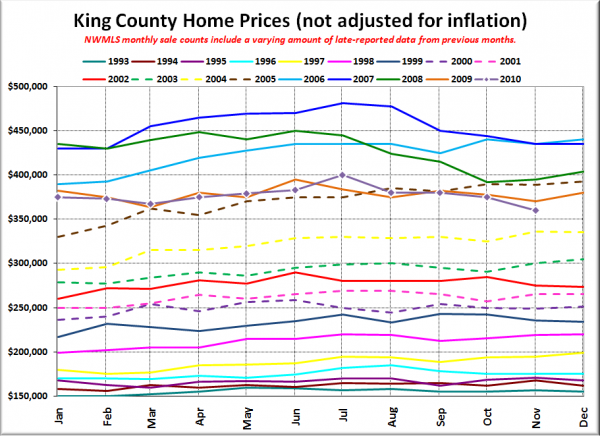
And lastly, here is the chart comparing King County SFH prices each month for every year back to 1994.
Yikes. Dropped quite a bit below the same month in 2005. Actually we hit the lowest point since April 2005, falling to a new record of 25.2% off the peak value. April 2005: $355,000. November 2010: $359,950.
Here are the news blurbs from the P-I and the Times:
Seattle P-I: Are we recovering from homebuyer tax-credit hangover?
Seattle Times: Median home prices in King County down from a year ago
Check back tomorrow, when all the local reporting will be mashed together in our reporting roundup.
