Get access to the full spreadsheets used to make the charts in this and other posts by becoming a member of Seattle Bubble.
It’s time for us to take a look at this month’s numbers to see how the sales mix shifted around the county in August.
In order to explore this concept, we break King County down into three regions, based on the NWMLS-defined “areas”:
- low end: South County (areas 100-130 & 300-360)
- mid range: Seattle / North County (areas 140, 380-390, & 700-800)
- high end: Eastside (areas 500-600)
Here’s where each region’s median prices came in as of August data:
- low end: $291,000-$397,250
- mid range: $405,000-$762,500
- high end: $532,200-$1,725,000
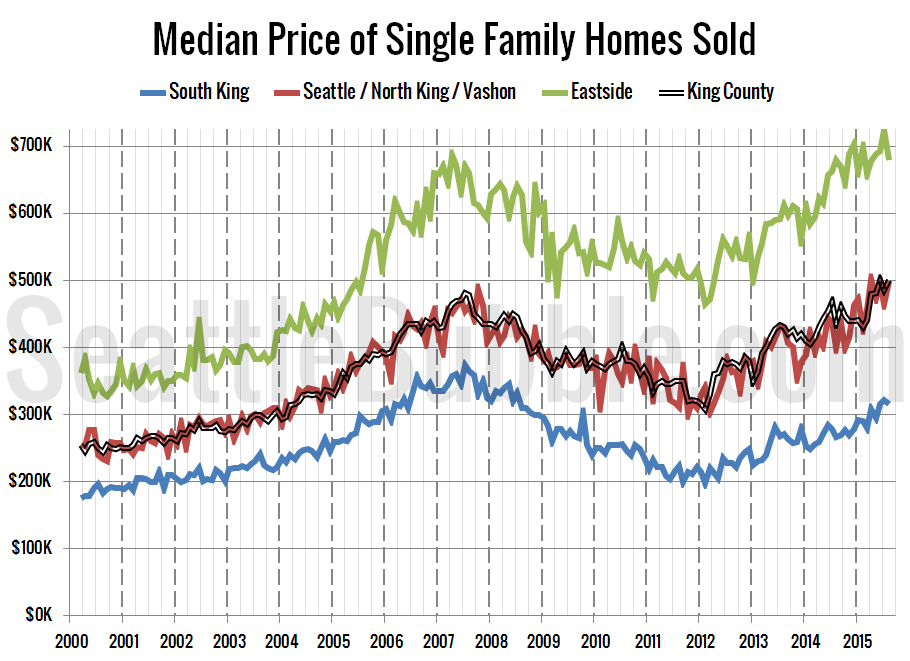
First up, let’s have a look at each region’s (approximate) median price (actually the median of the medians for each area within the region).
Only the middle tier actually saw a month-over-month gain in its respective median-median price, while the low and high tiers both fell slightly. At $499,500 in August, the middle tier is still slightly shy of its all-time high of $502,000 set in April. Month-over-month, the median price in the low tier fell 1.9 percent, the middle tier increased 7.4 percent, and the high tier lost 6.2 percent.
Twenty-seven of the twenty-nine NWMLS regions in King County with single-family home sales in August had a higher median price than a year ago, while sixteen had a month-over-month increase in the median price.
Here’s how the median prices changed year-over-year. Low tier: up 18.2 percent, middle tier: up 25.2 percent, high tier: flat.
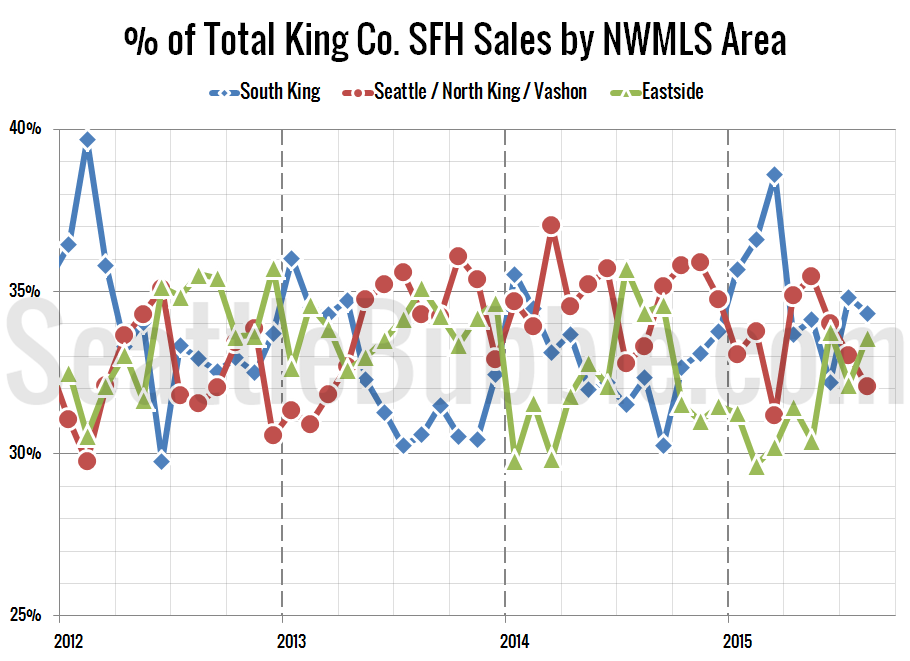
Next up, the percentage of each month’s closed sales that took place in each of the three regions.
Sales in all three tiers fell between July and August, with the low and middle tiers seeing the biggest dip. The sales mix shifted slightly toward the high tier since those regions didn’t see sales fall quite as much. Month-over-month sales were down 12.5 percent in the low tier, down 13.8 percent in the middle tier, and down 7.2 percent in the high tier.
Year-over-year sales increased in all three tiers. Compared to a year ago, sales increased 14.7 percent in the low tier, rose 4.0 percent in the middle tier, and gained 5.6 percent in the high tier.
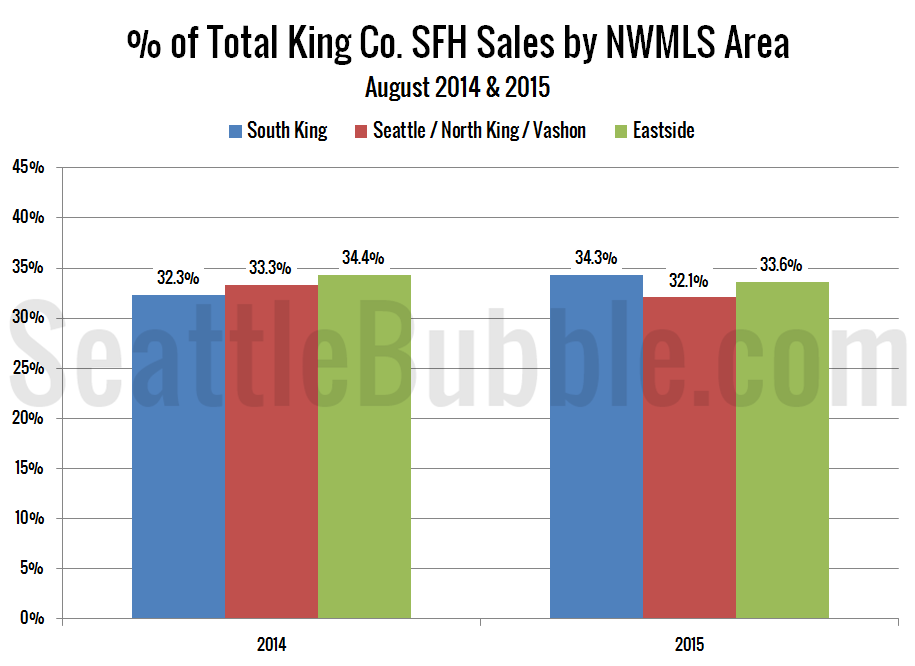
As of August 2015, 34.3 percent of sales were in the low end regions (up from 32.3 percent a year ago), 32.1 percent in the mid range (down from 33.3 percent a year ago), and 33.6 percent in the high end (down from 34.4 percent a year ago).
Here’s that information in a visual format:
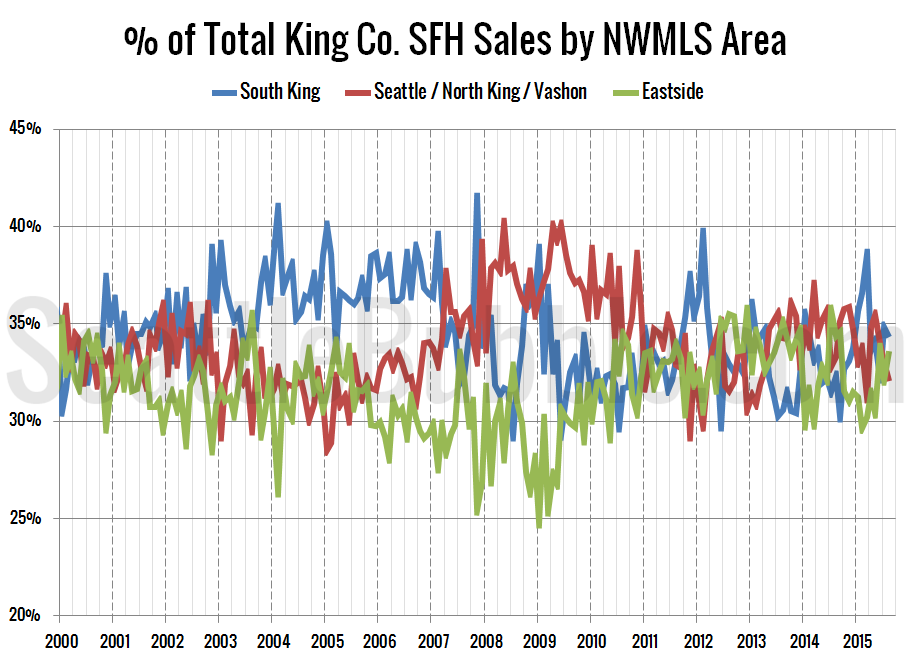
Finally, here’s an updated look at the percentage of sales data all the way back through 2000:
It’s interesting that the median price in the high tier regions was flat, despite double-digit gains in both of the other tiers. Sales aren’t really slowing much yet, what we’re seeing right now seems to be mostly a seasonal slowdown. This fall and winter we’ll be watching the market closely to see if any significant change is likely next year.


