Get access to the full spreadsheets used to make the charts in this and other posts, as well as a variety of additional insider benefits by becoming a member of Seattle Bubble.
December market stats were published by the NWMLS yesterday. Before we get into our monthly stats, here’s a quick look at their press release.
Puget Sound area home sales, prices still strong
Home prices have “clearly recovered” in King County and a few other areas served by Northwest Multiple Listing Service. Many member-brokers say prices are likely to keep rising as a backlog of buyers competes for depleted inventory.
…
The price of a single family home (excluding condos) that sold in King County during December jumped nearly 15.5 percent, from $440,000 to $508,000, prompting OB Jacobi, president of Windermere Real Estate to comment, “If December told us one thing, it’s that home prices have clearly recovered in King County. Last month the median price for single family homes broke the pre-recession record of $481,000 that was set in July 2007.”Another industry leader, J. Lennox Scott, chairman and CEO of John L. Scott, noted the 9.2 percent drop in King County’s pending sales during December, saying “The only reason pending sales dropped in King County was due to a lack of inventory.”
He knows that it is the only reason because he personally interviewed each and every potential homebuyer who backed out of the market. One hundred percent of them cited inventory. Certainly nobody was concerned about prices rising too quickly or the potential that we are in another housing bubble, fueled by an overheated tech industry.
NWMLS monthly reports include an undisclosed and varying number of
sales from previous months in their pending and closed sales statistics.
Here’s your King County SFH summary, with the arrows to show whether the year-over-year direction of each indicator is favorable or unfavorable news for buyers and sellers (green = favorable, red = unfavorable):
| December 2015 | Number | MOM | YOY | Buyers | Sellers |
|---|---|---|---|---|---|
| Active Listings | 1,764 | -23.4% | -36.0% |  |
 |
| Closed Sales | 2,058 | +18.2% | +3.8% |  |
 |
| SAAS (?) | 1.00 | +4.2% | -8.4% |  |
 |
| Pending Sales | 1,475 | -30.5% | -11.6% |  |
 |
| Months of Supply | 0.86 | -35.2% | -38.4% |  |
 |
| Median Price* | $508,000 | +1.6% | +15.5% |  |
 |
After setting a new all-time low inventory level in November, listings dropped off dramatically yet again to set another new all-time low in December. Here’s hoping we see somewhat of a turnaround in inventory for 2016. If not, expect another overheated year.
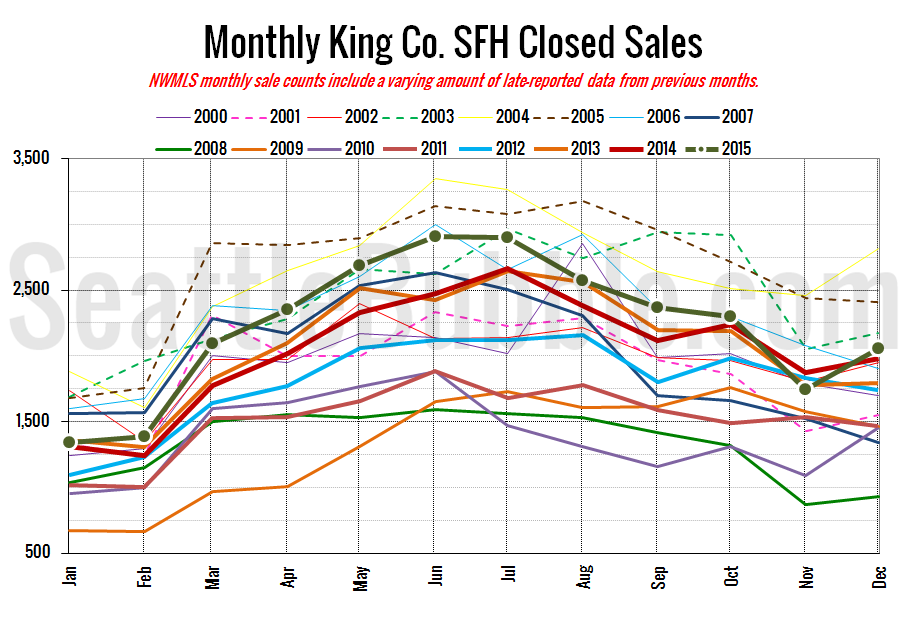
Here’s your closed sales yearly comparison chart:
Closed sales rose 18 percent from November to December. Last year they rose 6 percent over the same period. Meanwhile year-over-year closed sales bumped back from negative territory in November to a small gain of 4 percent in December.
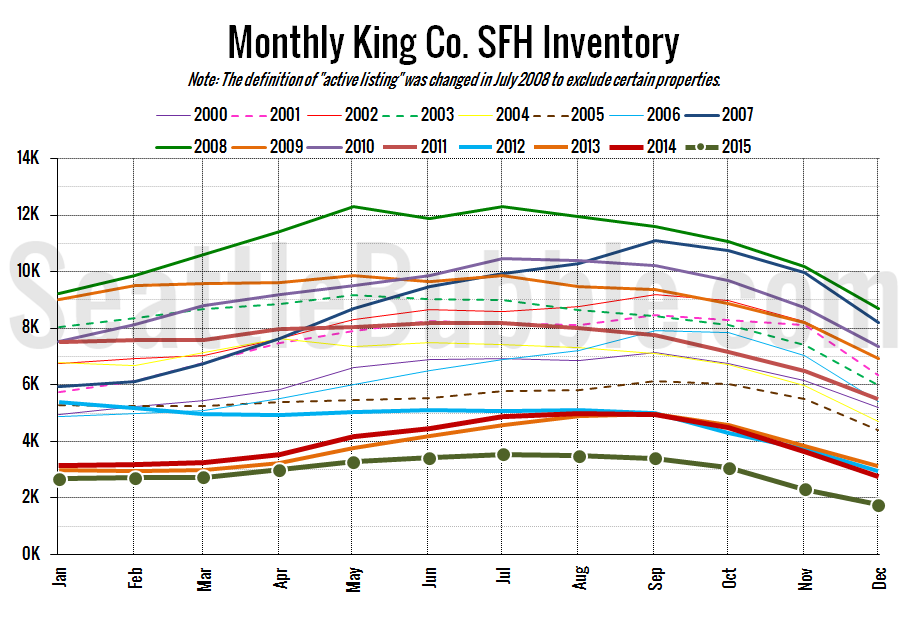
Here’s the graph of inventory with each year overlaid on the same chart.
Inventory fell dramatically yet again from November to December, with the year-over-year decline sticking in the mid-30% range it has been in for the last few months. December inventory came in at 1,764—the first time it has ever dropped below 2,000 or even below 2,300. The only good(ish) news for buyers is that presumably we can’t possibly get much lower than we are right now.
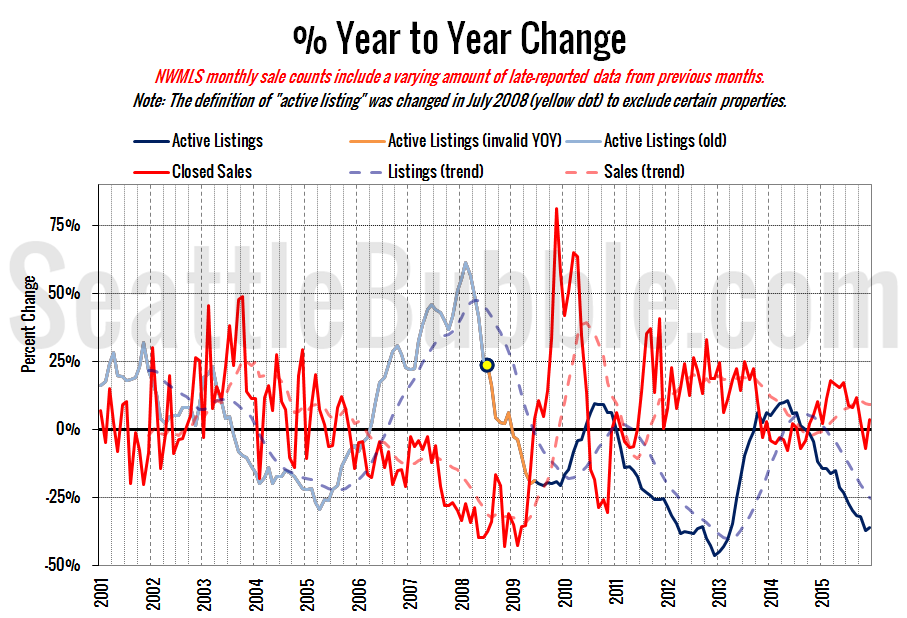
Here’s the supply/demand YOY graph. “Demand” in this chart is represented by closed sales, which have had a consistent definition throughout the decade (unlike pending sales from NWMLS).
After moving back to the buyer’s side of the chart last month, the red demand line went back into positive territory again in December. The blue supply line still shows no signs of moving toward back toward balance.
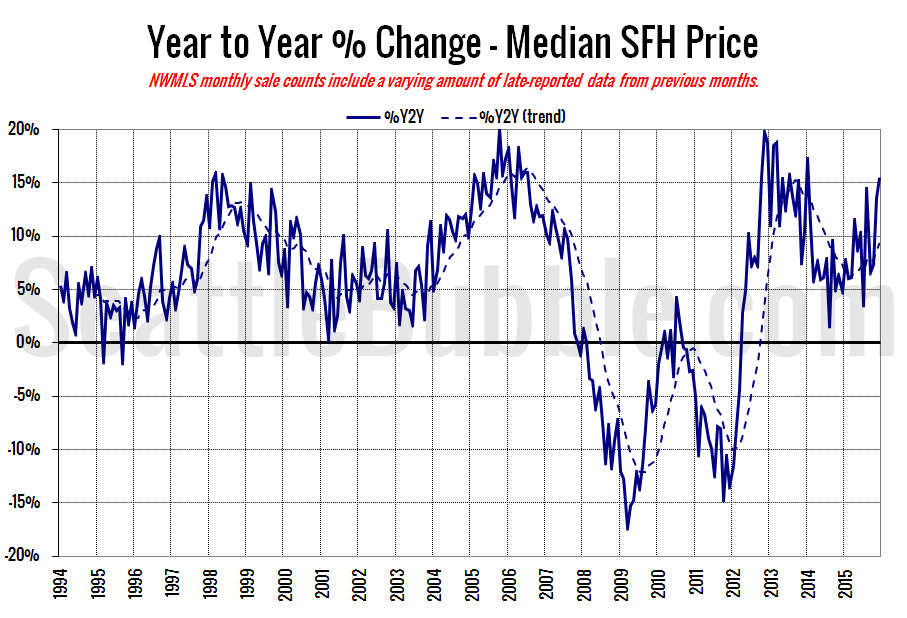
Here’s the median home price YOY change graph:
Year-over-year price growth increased again from +13.6 percent in November to +15.5 percent in December.
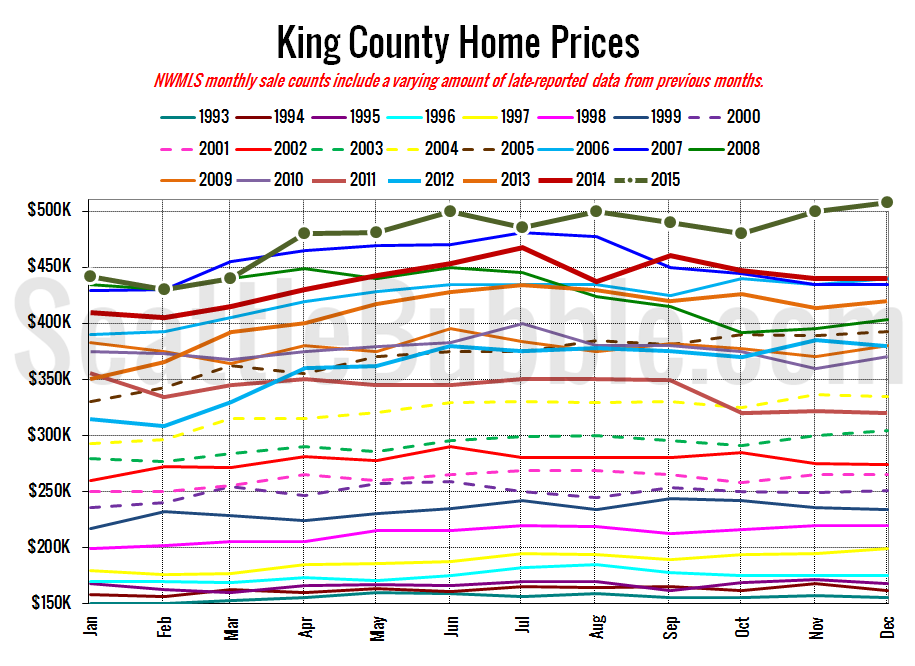
And lastly, here is the chart comparing King County SFH prices each month for every year back to 1994 (not adjusted for inflation).
The median home price broke out of the $480,000 to $500,000 range it was in between April and November, posting a new all-time high of $508,000 in December.
October 2015: $499,950
July 2007: $481,000 (pre-2015 high)
Here’s this month’s article from the Seattle Times: King County home prices hit new highs, inventory at new lows
Check back tomorrow for the full reporting roundup.
