Get access to the full spreadsheets used to make the charts in this and other posts, as well as a variety of additional insider benefits by becoming a member of Seattle Bubble.
March market stats have been published by the NWMLS. Here’s a quick excerpt from their press release:
Housing Market Back to “Pressure Cooker Situation” But Brokers Remind Sellers “Pricing Is Still Important”
Job growth and a recent run-up in mortgage rates has created an “extremely intense market for each new listing,” stated J. Lennox Scott, chairman and CEO of John L. Scott Real Estate in commenting on the latest statistics from Northwest Multiple Listing Service.
“What used to be a quick action market for buyers is now, once again, an instant response market, and this has been the case since the first of the year,” remarked Scott, adding “This is especially true in the more affordable and mid-price ranges in all markets, and also pertains to luxury properties close to the job centers.”
…
“We have returned to an extremely intense market for each new listing due to extremely strong job growth and eager buyers who want to purchase before interest rates go higher,” Scott reported. “The housing market is back to a pressure cooker situation and we are witnessing high levels of sales activity intensity for each new listing coming on the market,” he commented.Dick Beeson, principal managing broker at RE/MAX Professionals in Tacoma, commented on the frustration many would-be homebuyers are experiencing. “I think this last quarter especially, many buyers are feeling like they brought a knife to a gunfight, there’s been so much competition to buy a home.”
I’m honestly running out of snarky things to say about Lennox Scott and Dick Beeson’s endless breathless cheerleading.
Now let’s dive into the numbers for March.
NWMLS monthly reports include an undisclosed and varying number of
sales from previous months in their pending and closed sales statistics.
Here’s your King County SFH summary, with the arrows to show whether the year-over-year direction of each indicator is favorable or unfavorable news for buyers and sellers (green = favorable, red = unfavorable):
| March 2018 | Number | MOM | YOY | Buyers | Sellers |
|---|---|---|---|---|---|
| Active Listings | 1,687 | +24.1% | -0.9% |  |
 |
| Closed Sales | 1,883 | +34.2% | -9.4% |  |
 |
| SAAS (?) | 1.49 | +30.3% | +17.7% |  |
 |
| Pending Sales | 2,710 | +43.1% | -0.5% |  |
 |
| Months of Supply | 0.90 | -7.5% | +9.4% |  |
 |
| Median Price* | $689,950 | +6.2% | +15.0% |  |
 |
Despite the big bump up in prices to a new all-time high, there is some good-ish news for home buyers in the March data. Compared to a year ago, new listings are up, total listings were basically flat, and sales were down. The overall market is still definitely heavily skewed toward sellers, but at least last month’s trends are finally moving a little bit in buyers’ favor.
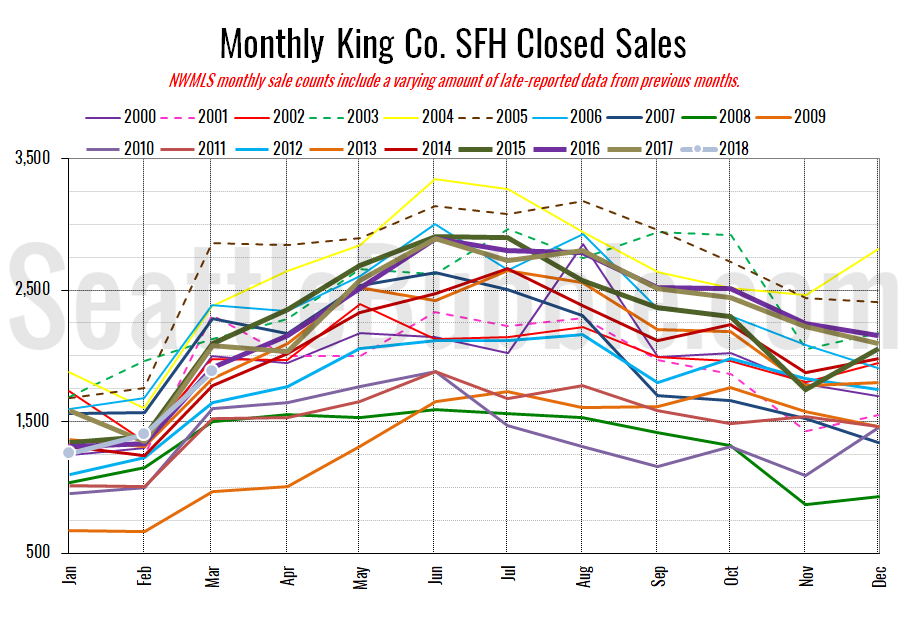
Here’s your closed sales yearly comparison chart:
Closed sales rose thirty-four percent between February and March. Last year over the same period closed sales were up fifty-four percent. Year-over-year closed sales were down nine percent.
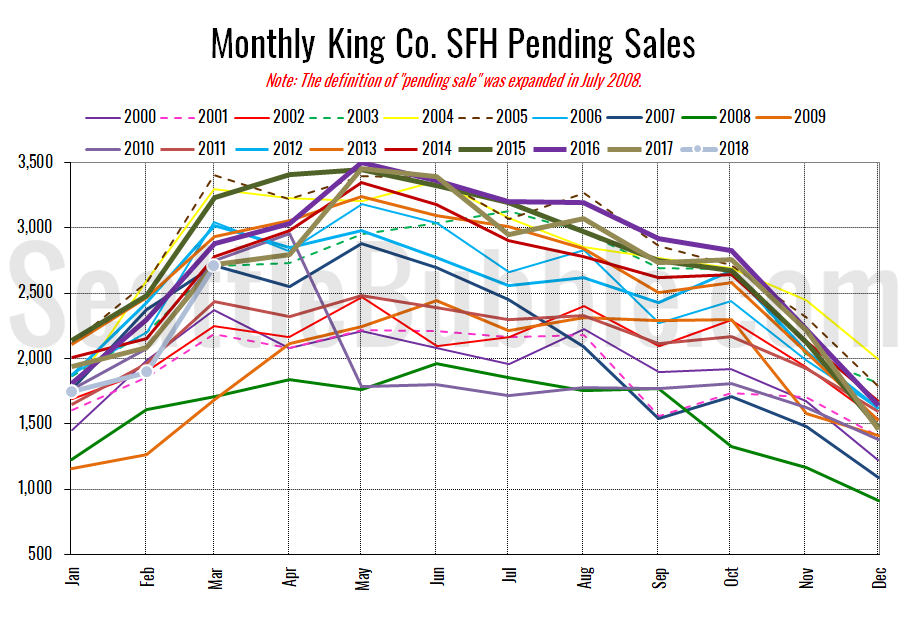
Pending sales were up forty-three percent from February to March, and were down half a percent year-over-year.
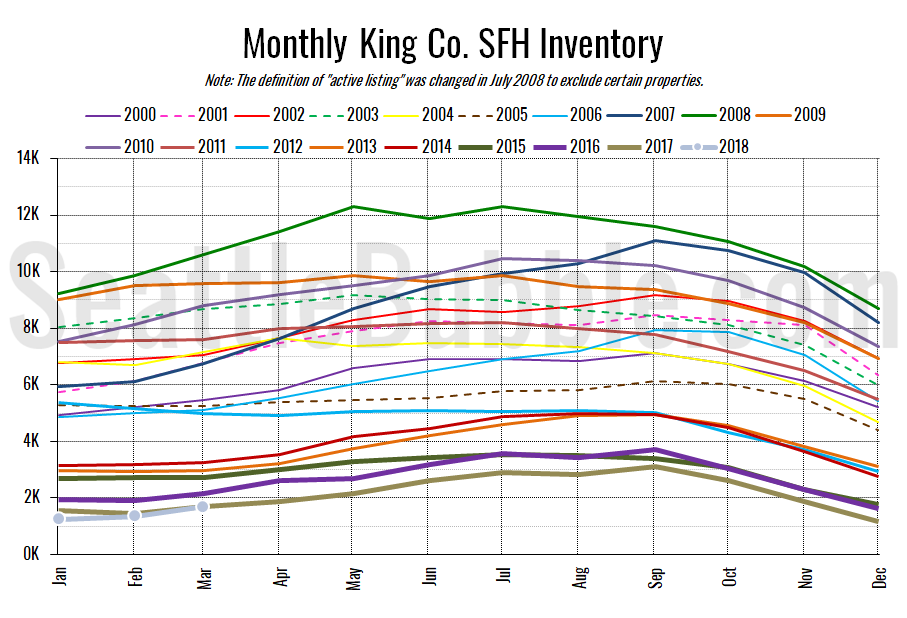
Here’s the graph of inventory with each year overlaid on the same chart.
Inventory rose twenty-four percent from February to March, and was down just one percent from last year. Although it was a relatively small decrease, it still marks a new historic low point for March inventory.
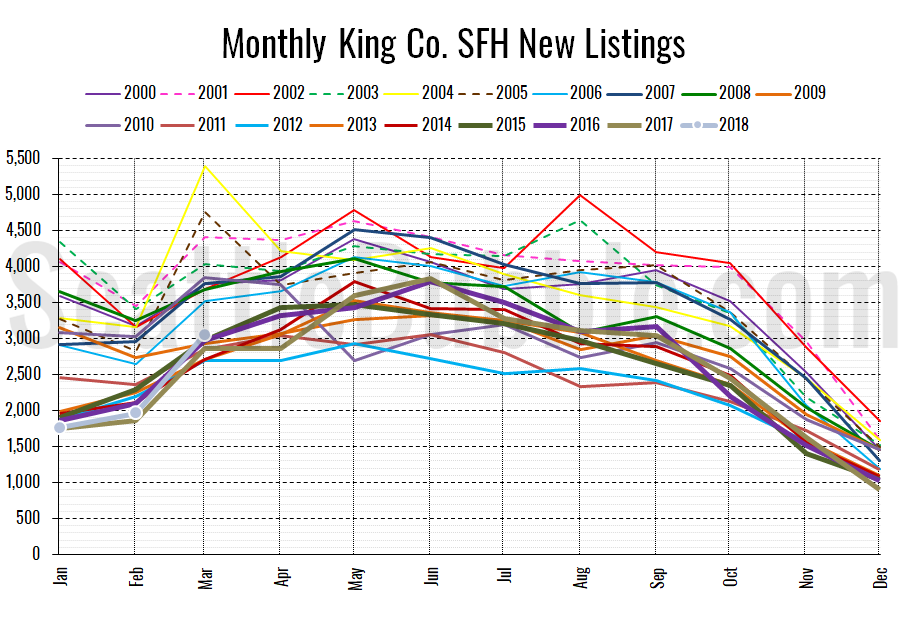
Here’s the chart of new listings:
New listings were up seven percent from a year ago.
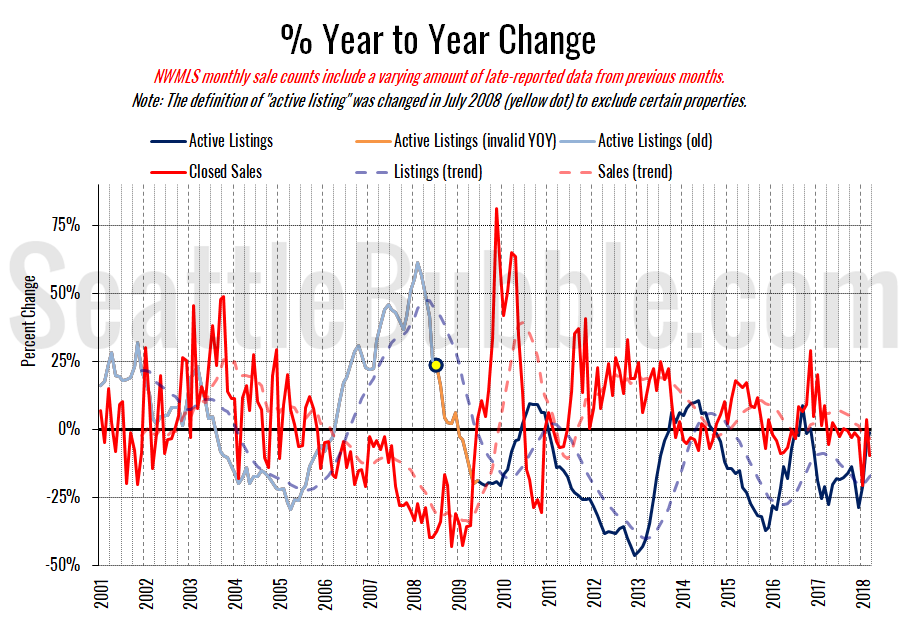
Here’s the supply/demand YOY graph. “Demand” in this chart is represented by closed sales, which have had a consistent definition throughout the decade (unlike pending sales from NWMLS).
The last few months the trend of increasing supply and decreasing demand on the year-over-year chart is at least a little hopeful for buyers.
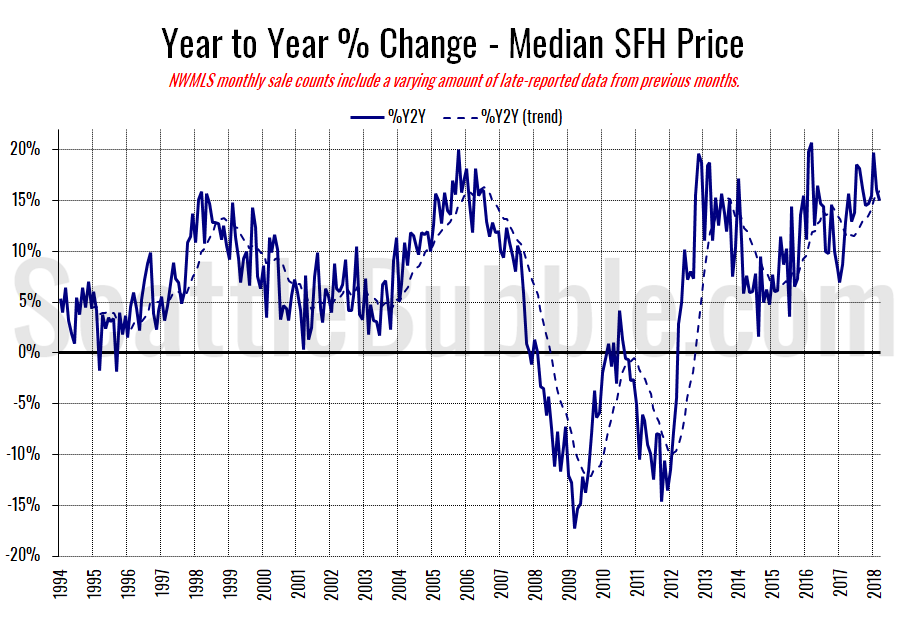
Here’s the median home price YOY change graph:
Despite the new all-time high for prices, year-over-year price changes were down a bit from their recent high of nearly twenty percent in January.
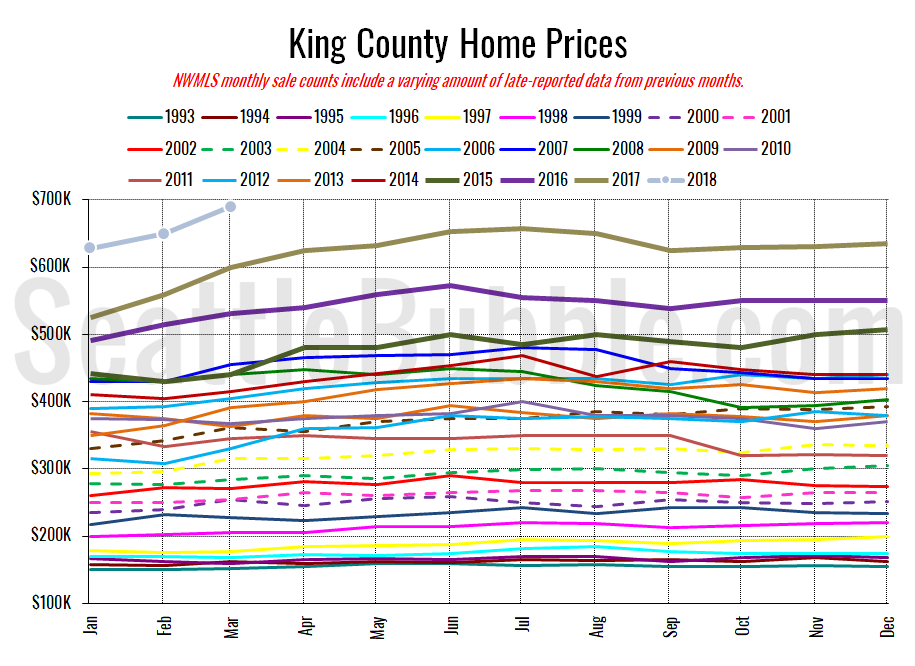
And lastly, here is the chart comparing King County SFH prices each month for every year back to 1994 (not adjusted for inflation).
New all-time high. Pretty clearly I’ll need to update the axis on this chart very soon.
March 2018: $689,950
July 2007: $481,000 (previous cycle high)
Here’s the article from the Seattle Times: Home prices have risen fastest in South Seattle, as citywide median nears $820,000
