Get unlimited access to the full spreadsheets used to make the charts in this and other posts, and support the ongoing work of this site by becoming a member of Seattle Bubble.
The big increase in listings is the first interesting development we’ve seen in the local real estate market in months, so here are a few alternative takes on recent home listing activity.
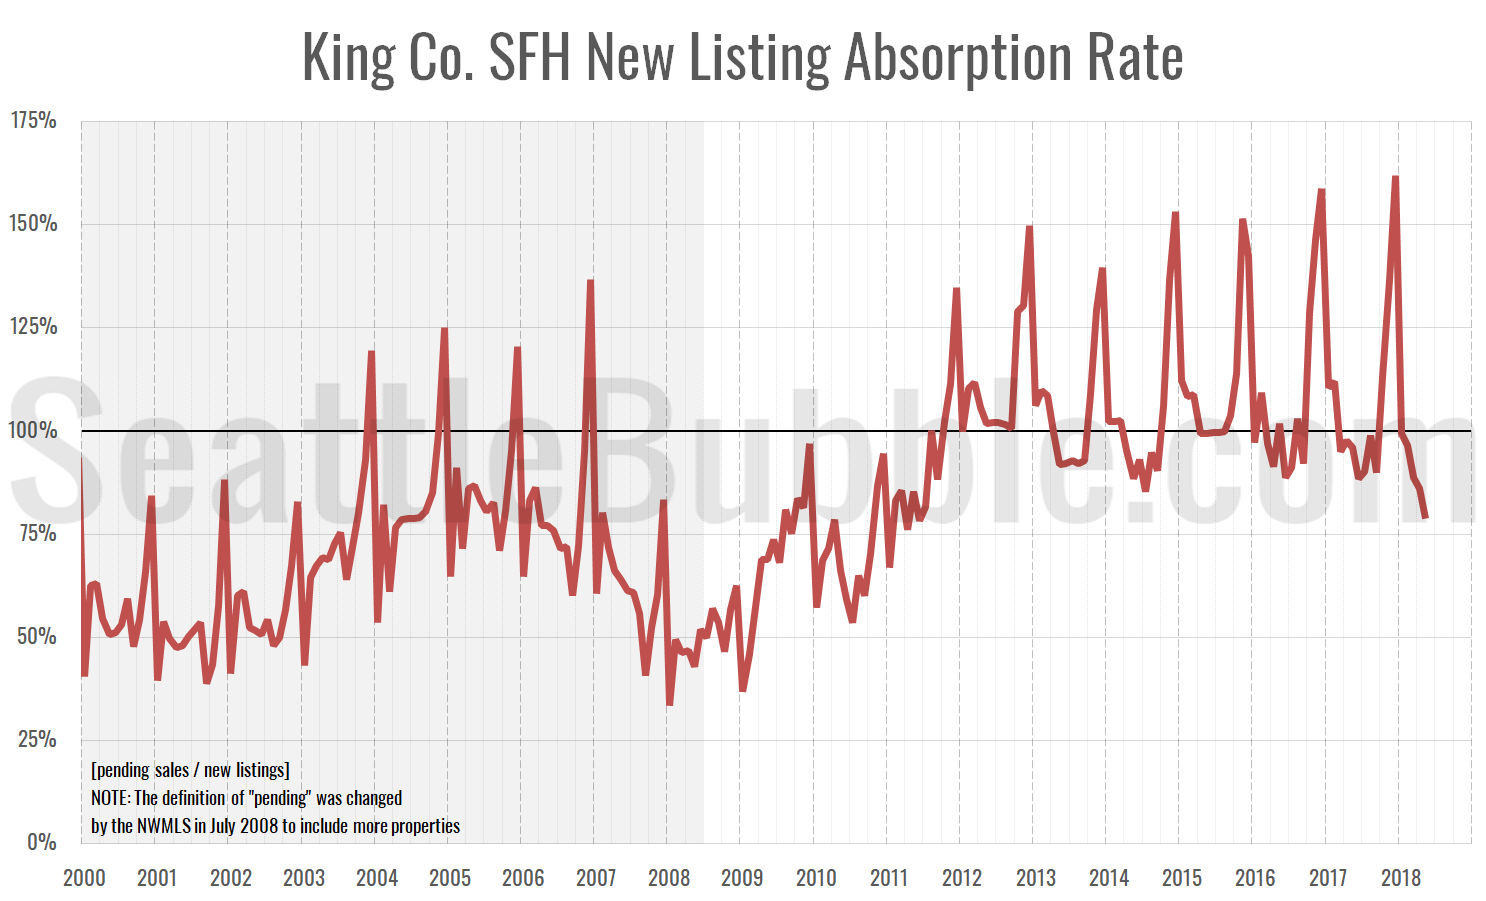
First up, here’s a chart of new listing absorption. This is a simple look at the ratio of pending sales to new listings. If more homes are going pending in a month than there are being listed, this ratio goes above 100 percent, which is obviously not great for buyers.
As of May, the absorption metric has dropped to 79 percent—its lowest level since June 2011. Interestingly, the rate was at its all-time highest level just last December at 162 percent. The absorption rate typically hits its lowest point of the year in June or July, so seeing it drop this low this fast is highly unusual.
Keep in mind that the pre-2008 data is not directly comparable, since in July 2008 the NWMLS changed how they define “pending sale” to include more sales.
About a year ago when I first introduced the listing absorption metric, I said:
I suspect that one of the first signs we’ll see of the market softening is when new listing absorption starts to drop, so I’ll be keeping an eye on this.
That’s definitely happening right now, so it will be very interesting to see if this trend continues through the rest of 2018.
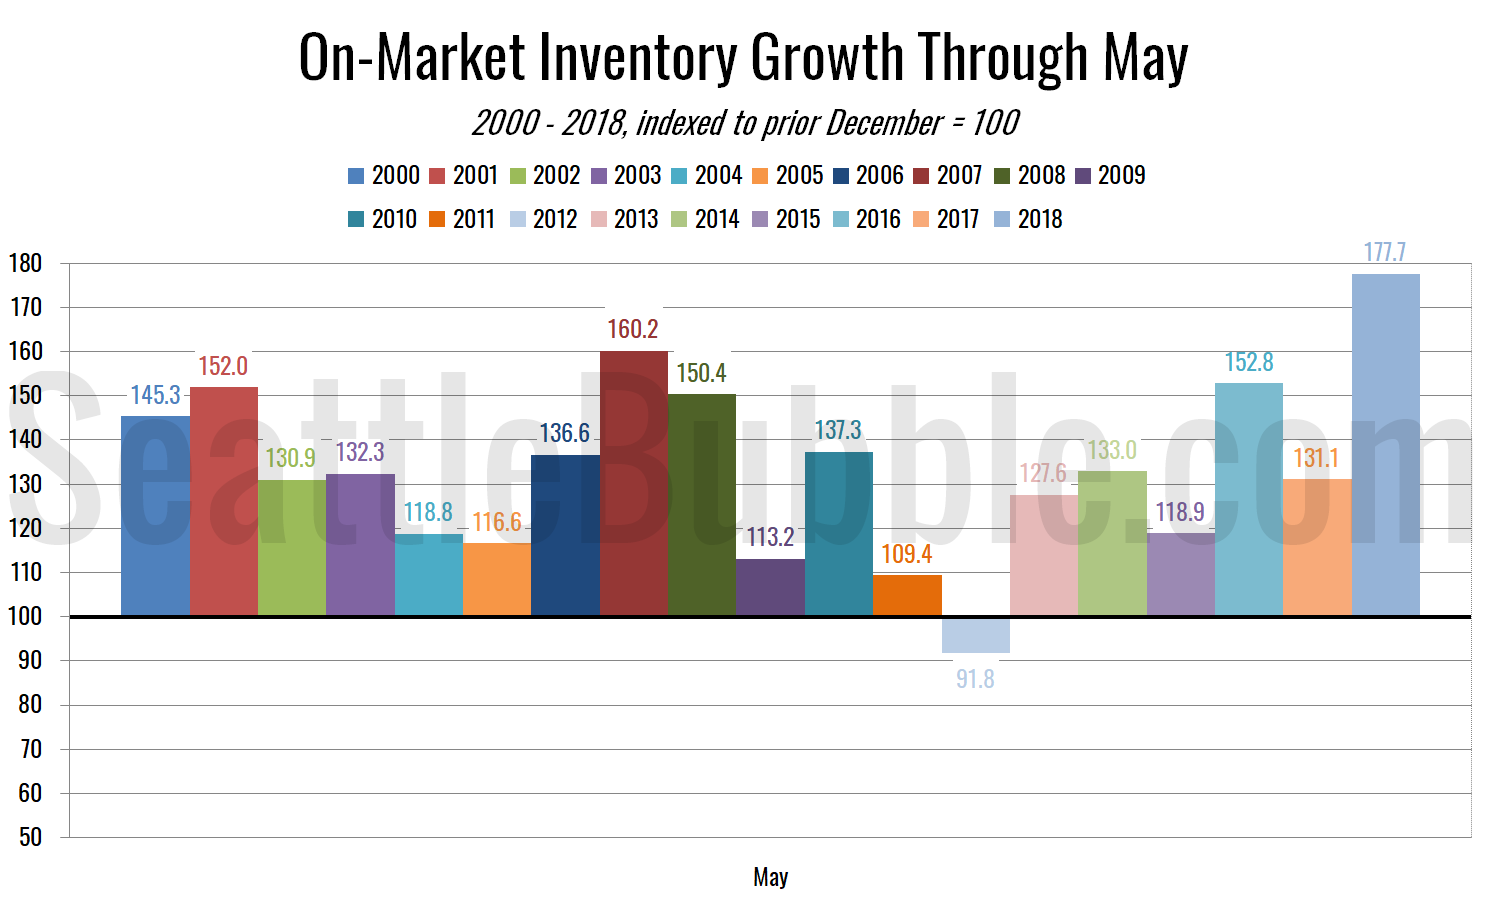
Next up: a comparison of total on-market inventory growth through May for each year:
Last December was an all-time low for on-market inventory, so it’s not too surprising that now that inventory is on the rise, this year set the record for the largest percent gain between December and May. Still though, it’s a good sign for buyers that relief may be around the corner.
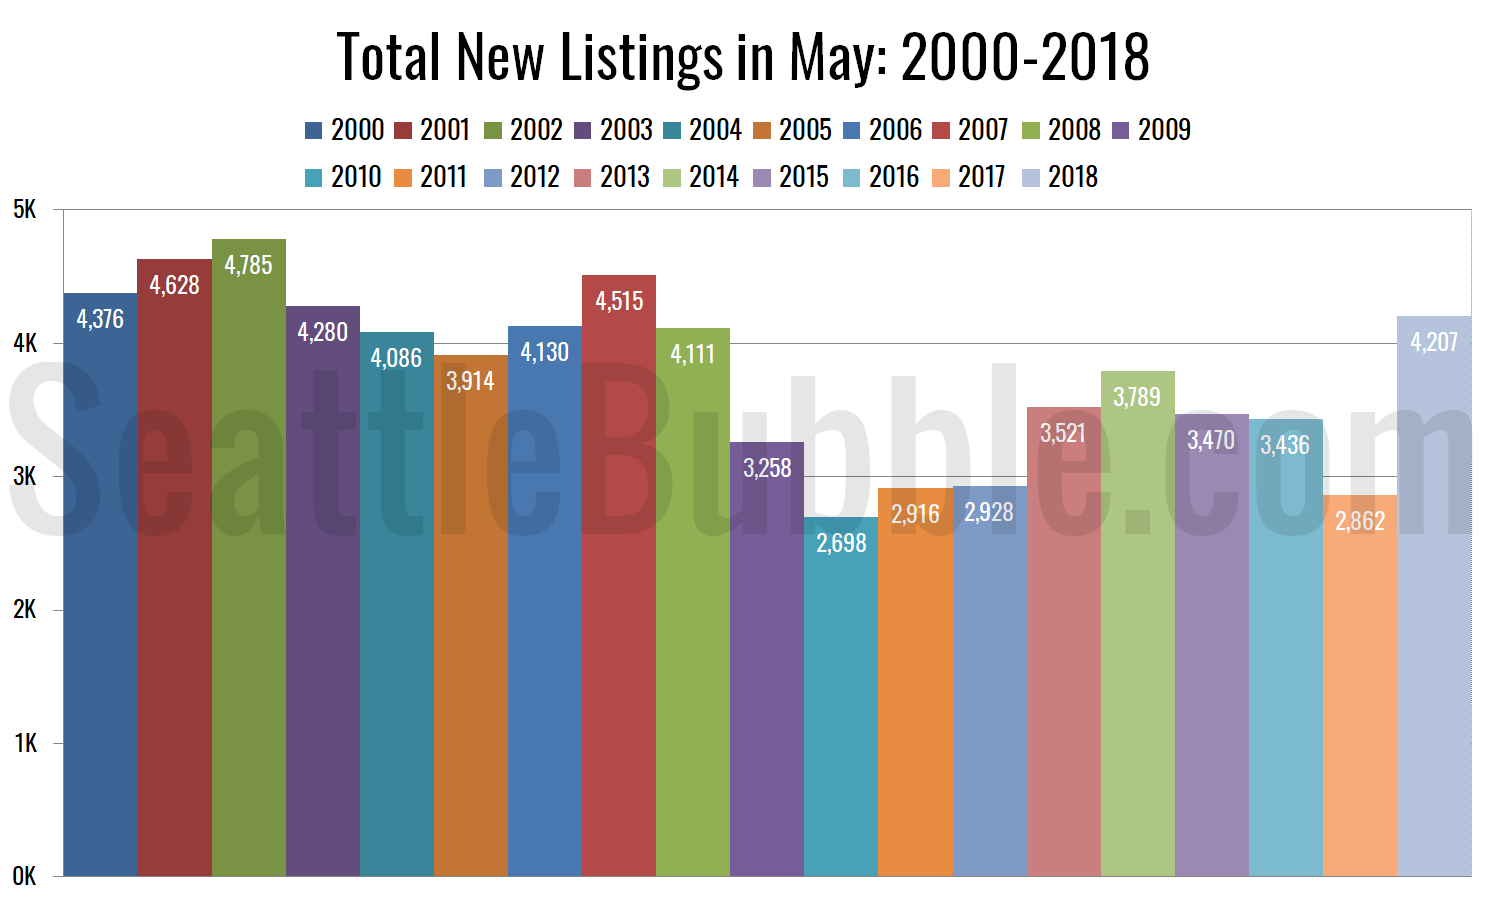
Next, here’s a yearly comparison of the total number of new listings just in the month of May:
Only five years since 2000 have seen more single-family homes hit the market in May than we saw this year. It would be interesting to see if there are any specific attributes common among many of the homes that are hitting the market now.
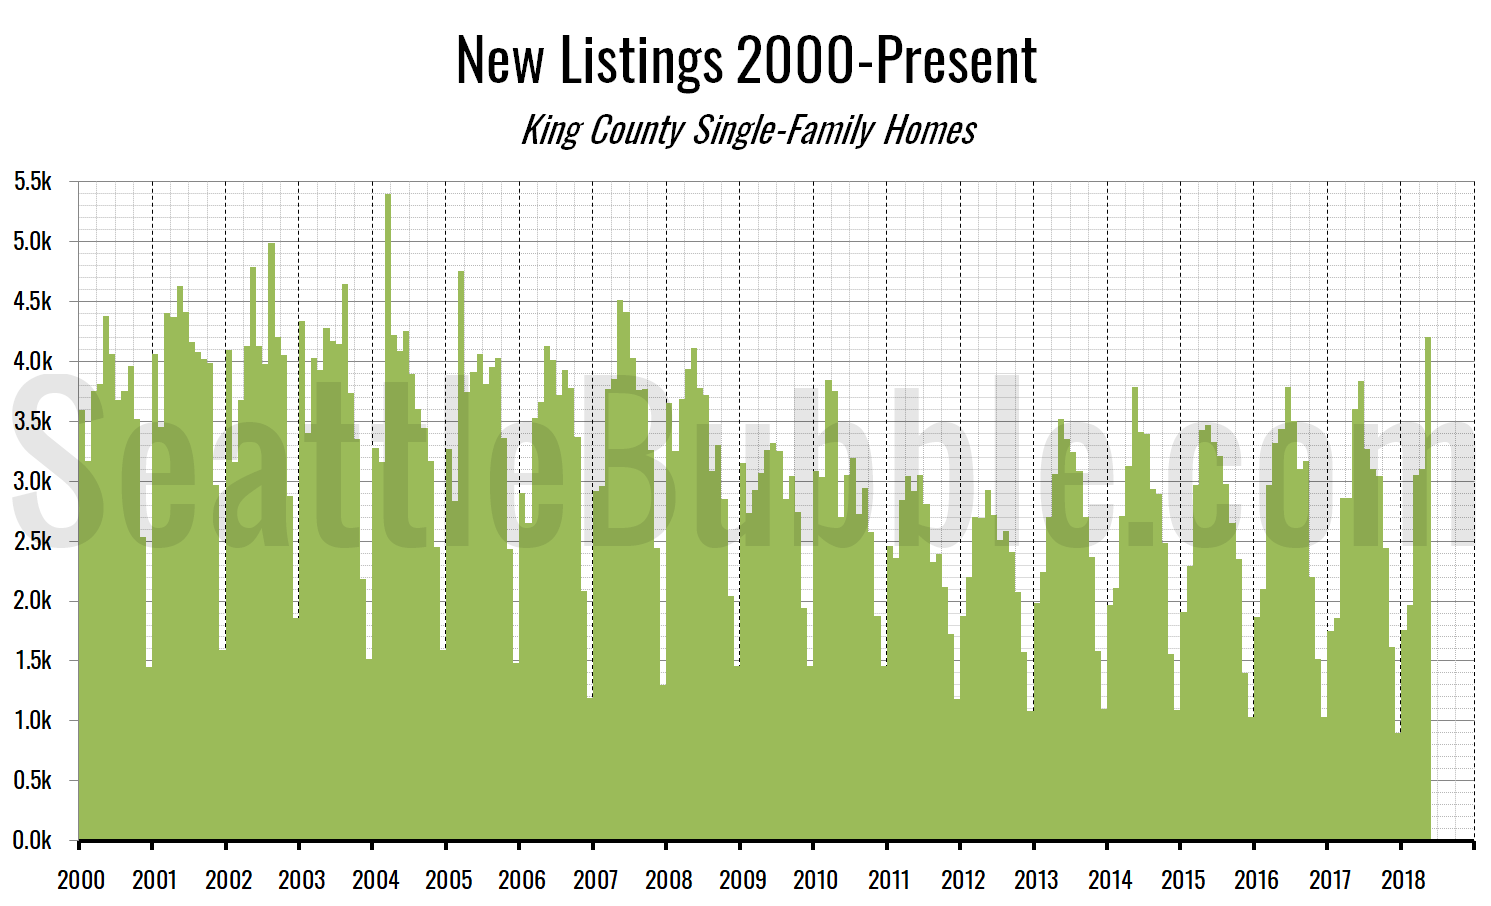
Finally, here’s a broad look at monthly new listings since January 2000:
I’m not calling a big turn in the market just yet, but it’s definitely a promising sign. We’ll see how the rest of the year shakes out.


