Get access to the full spreadsheets used to make the charts in this and other posts, as well as a variety of additional insider benefits by becoming a member of Seattle Bubble.
June market stats were published by the NWMLS last week. Here’s a quick look at the home salesperson spin via their press release:
Brokers seeing “simple economic recipe for a softening housing market”
Home buyers around many parts of Washington state had more choices and less competition during June, prompting some industry leaders to comment on “a feeling of change in the market.”
“Inventory is up and demand has dropped,” reported Robert Wasser, an officer with the board of directors at Northwest Multiple Listing Service. That combination is “a pretty simple economic recipe for a softening market,” he added in commenting on the latest MLS statistics.
…
“Although still a quick response market, with more new listings coming on the market during the summer months, we experienced dispersed buyer energy due to the greater availability and selection,” stated J. Lennox Scott, chairman and CEO of John L. Scott Real Estate.
No need for alarm! It’s just a “simple economic recipe”!
Anyway, let’s look at the actual numbers.
NWMLS monthly reports include an undisclosed and varying number of
sales from previous months in their pending and closed sales statistics.
Here’s your King County SFH summary, with the arrows to show whether the year-over-year direction of each indicator is favorable or unfavorable news for buyers and sellers (green = favorable, red = unfavorable):
| June 2018 | Number | MOM | YOY | Buyers | Sellers |
|---|---|---|---|---|---|
| Active Listings | 3,718 | +27.7% | +42.9% |  |
 |
| Closed Sales | 2,758 | +11.5% | -4.6% | |
|
| SAAS (?) | 1.46 | -8.5% | +6.8% | |
|
| Pending Sales | 2,977 | -10.1% | -12.2% | |
|
| Months of Supply | 1.35 | +14.5% | +49.8% | |
|
| Median Price* | $715,000 | -1.6% | +9.5% | |
|
The big news in this month’s numbers is yet again the big bump in total on-market inventory. That said, prices look like they’re beginning to soften as well, which is unusual for what is normally the hottest time of year for price gains.
Here’s the graph of inventory with each year overlaid on the same chart.

Inventory rose twenty-eight percent from May to June, and was up forty-three percent from last year. We’re definitely forming an interesting trend now. This year has seen listings building up a lot faster than any recent year. Meanwhile, sales are softening, too…
Here’s the chart of new listings:

New listings were up two percent from a year ago, but dipped slightly from the record high level posted in May.
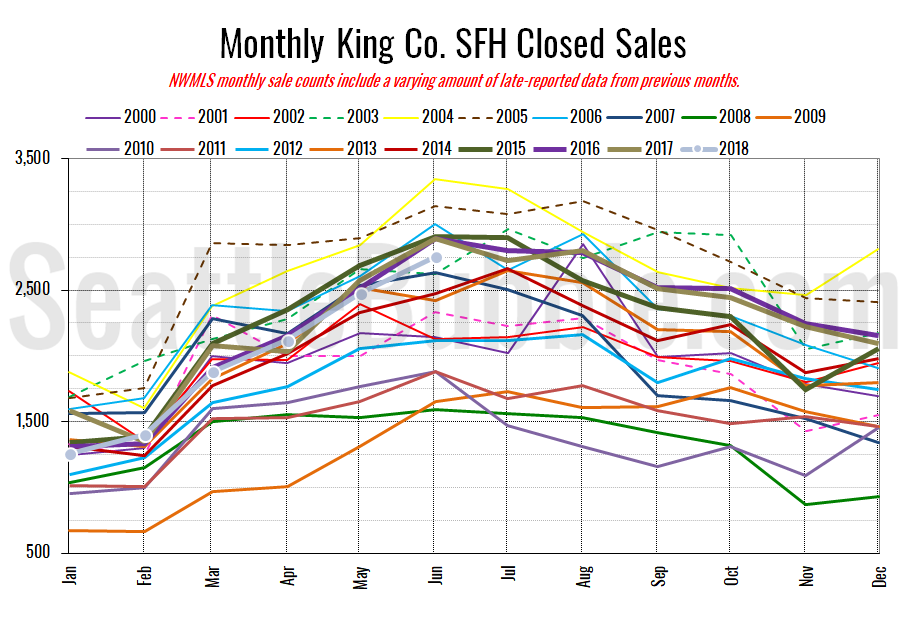
Here’s your closed sales yearly comparison chart:

Closed sales rose eleven percent between May and June. Last year over the same period closed sales were up about the same. Year-over-year closed sales were down five percent.

Pending sales were down ten percent from May to June, and were down twelve percent year-over-year.
Here’s the supply/demand YOY graph. “Demand” in this chart is represented by closed sales, which have had a consistent definition throughout the decade (unlike pending sales from NWMLS).

The recent surge in listings is extremely evident in the above chart. June saw the largest year-over-year listings increase since April 2008.
Here’s the median home price YOY change graph:

Year-over-year home price movement dipped back below ten percent again.
And lastly, here is the chart comparing King County SFH prices each month for every year back to 1994 (not adjusted for inflation).

It’s interesting to me that we’ve been flat to slightly down since April. That’s a pretty big deviation from normal years. Between 2000 and 2017, April to June has seen an average gain of 3.5 percent. Over the last six years the lowest gain we’ve seen over those months was 4.2 percent. This year prices fell 1.4 percent. Very curious.
May 2018: $715,000
July 2007: $481,000 (previous cycle high)
Here’s the article from the Seattle Times: Market shift? Big spike in Seattle-area homes for sale slows price growth