Get access to the full spreadsheets used to make the charts in this and other posts, as well as a variety of additional insider benefits by becoming a member of Seattle Bubble.
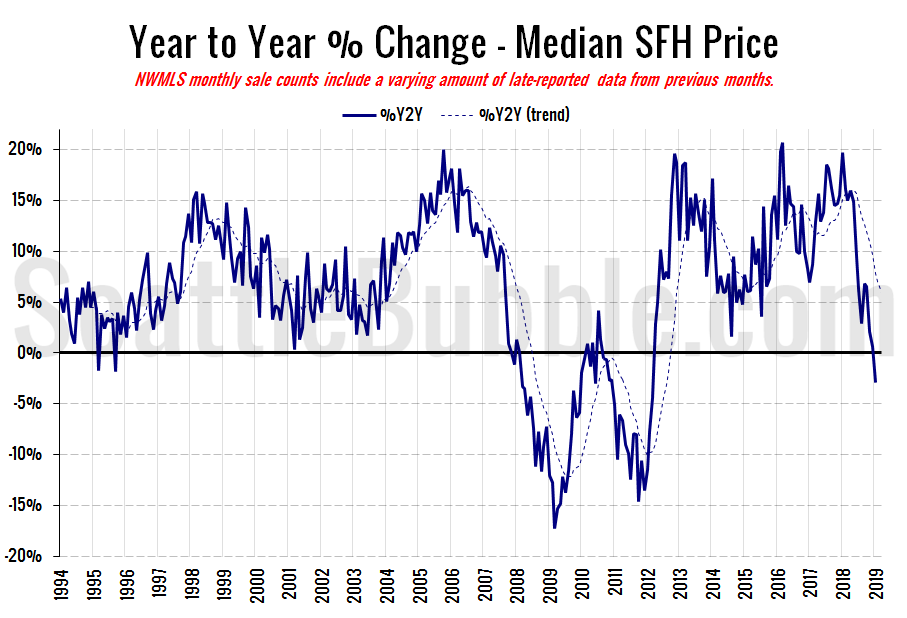
January market stats were published by the NWMLS yesterday. The King County median price of single-family homes fell year-over-year for the first time since March of 2012. Inventory is way up from a year ago, but pending sales started increasing year-over-year, so buyers may be coming back.
Before we get into our detailed monthly stats, here’s a quick look at their press release.
Homebuyers resuming search amid improving inventory, attractive terms
Home buyers around Washington state are making their way back to the market, hoping to take advantage of improving inventory, attractive interest rates, and more approachable sellers, according to officials with Northwest Multiple Listing Service.
…
J. Lennox Scott, chairman and CEO of John L. Scott Real Estate, said buyers “came out of the woodwork” after the holidays, eager to take advantage of better housing conditions. “Areas close to the job centers are seeing improved affordability from spring 2018,” he said, attributing it to lower interest rates, strong job growth, and adjusted pricing.
I’m not a professional used-house salesman like Lennox, but to me it seems like not a great idea to compare your clients to insects crawling out of the walls in a dilapidated home. But hey, you do you Lennox.
NWMLS monthly reports include an undisclosed and varying number of
sales from previous months in their pending and closed sales statistics.
Here’s your King County SFH summary, with the arrows to show whether the year-over-year direction of each indicator is favorable or unfavorable news for buyers and sellers (green = favorable, red = unfavorable):
| January 2019 | Number | MOM | YOY | Buyers | Sellers |
|---|---|---|---|---|---|
| Active Listings | 2,820 | -0.6% | +126.9% |  |
 |
| Closed Sales | 1,224 | -28.2% | -2.8% |  |
 |
| SAAS (?) | 1.17 | +24.9% | +16.1% |  |
 |
| Pending Sales | 1,904 | +38.8% | +9.0% |  |
 |
| Months of Supply | 2.30 | +38.3% | +133.4% |  |
 |
| Median Price* | $610,000 | -4.5% | -2.9% |  |
 |
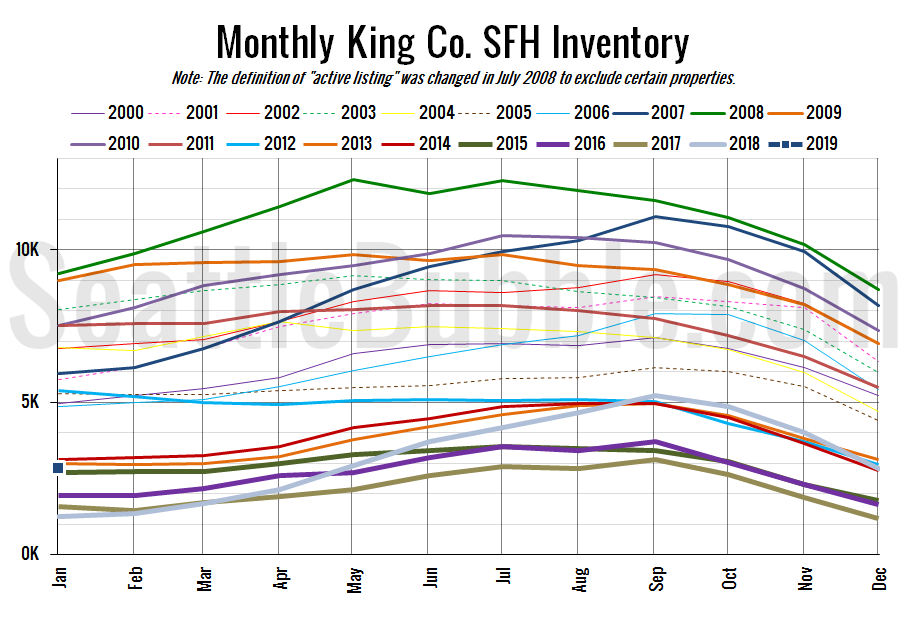
Here’s the graph of inventory with each year overlaid on the same chart.
Inventory fell half a percent from December to January, but was up 127 percent from last year. The last time there were over 2,750 homes on the market at the end of January was in 2014.
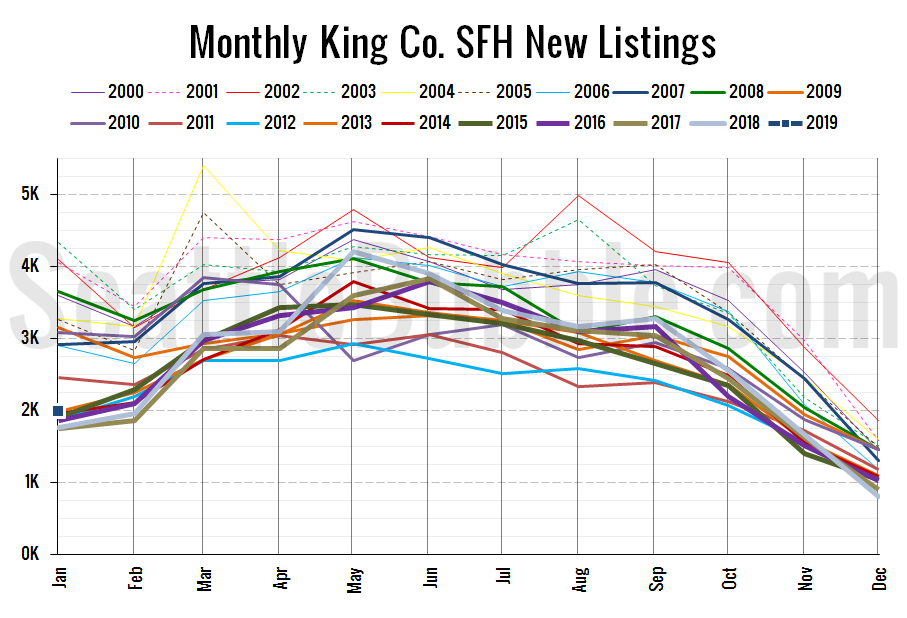
Here’s the chart of new listings:
New listings were up 13 percent from a year ago, and more than doubled from December to January.
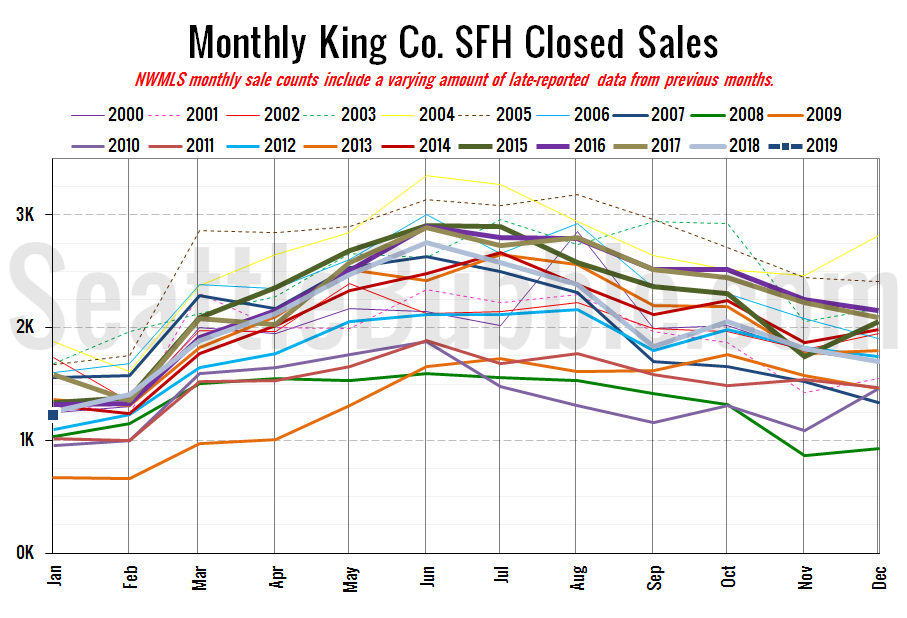
Here’s your closed sales yearly comparison chart:
Closed sales fell 28 percent between December and January. Last year over the same period closed sales dropped 40 percent. Year-over-year closed sales were down just three percent.
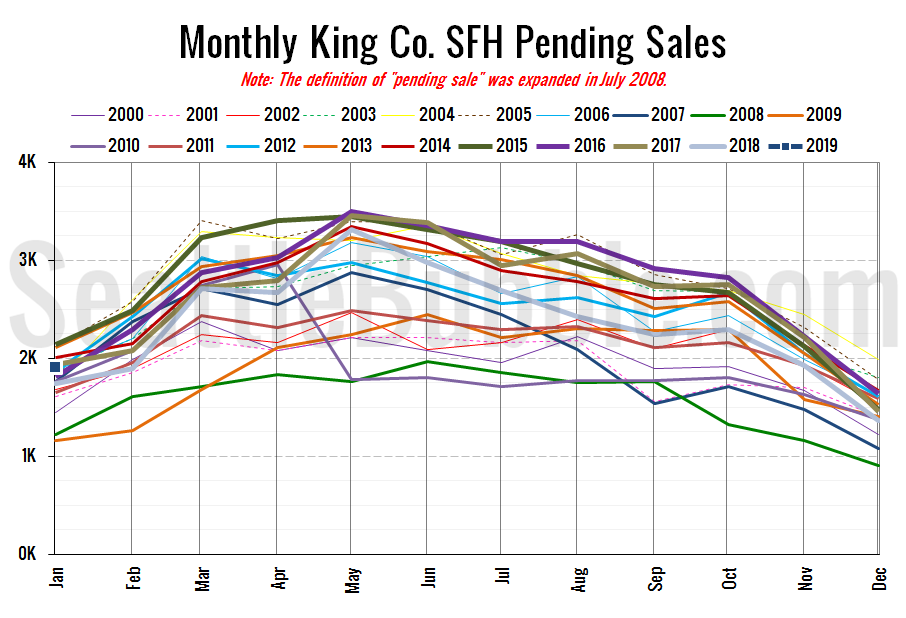
Pending sales shot up 39 percent from December to January, and were up nine percent year-over-year.
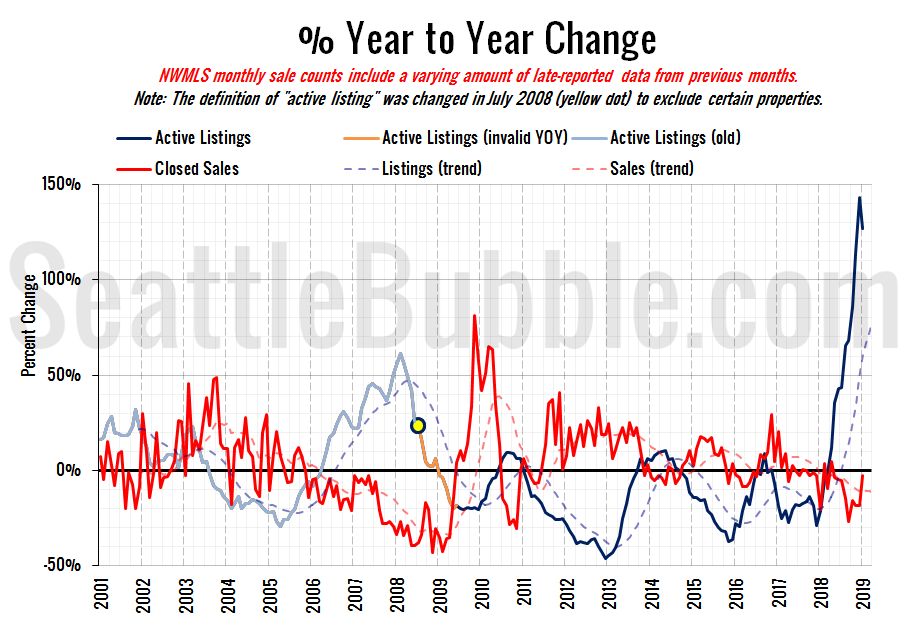
Here’s the supply/demand YOY graph. “Demand” in this chart is represented by closed sales, which have had a consistent definition throughout the decade (unlike pending sales from NWMLS).
Still a huge year-over-year increase in listings, but the growth did fall off a bit from December to January.
Here’s the median home price YOY change graph:
Year-over-year home price changes dropped below zero for the first time in nearly seven years. I doubt we’ll see this continue to fall, but… maybe?
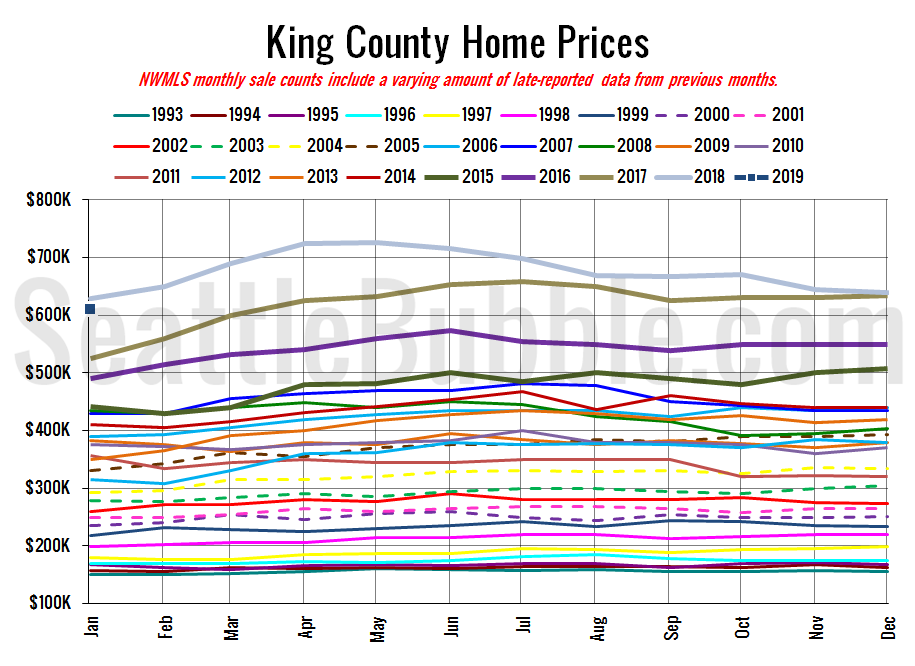
And lastly, here is the chart comparing King County SFH prices each month for every year back to 1994 (not adjusted for inflation).
January 2019: $610,000
January 2018: $628,388
July 2007: $481,000 (previous cycle high)
Here’s the article from the Seattle Times: Seattle-area home prices drop to lowest point in two years — down $116,000 since last spring
