Get access to the full spreadsheets used to make the charts in this and other posts, as well as a variety of additional insider benefits by becoming a member of Seattle Bubble.
I’ve gotten way behind recently as life and other projects have gotten busy, and I apologize.
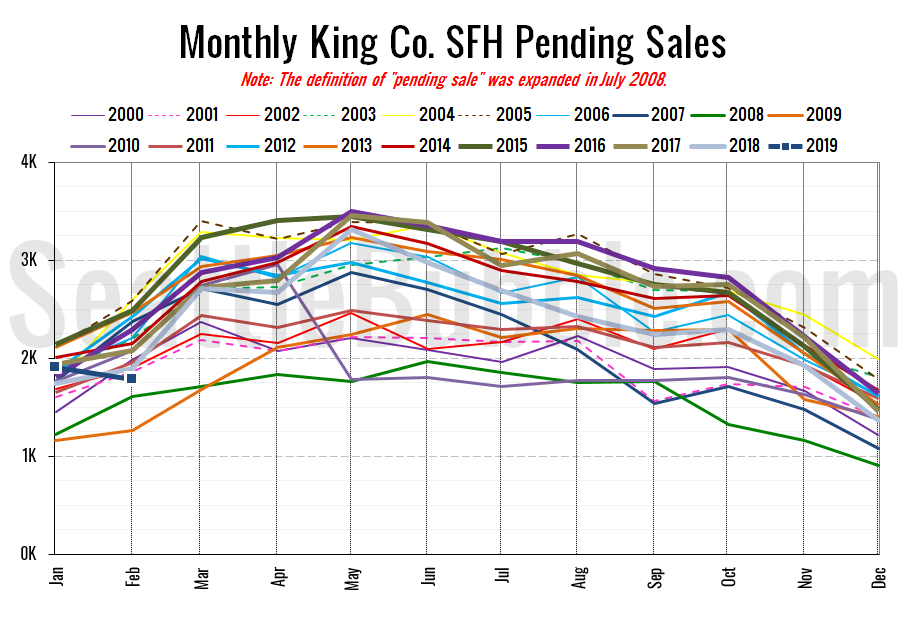
Let’s play some catchup and take a look at February market stats from the NWMLS. The King County median price of single-family homes was basically flat year-over-year in February, inventory was way up from a year ago but not by as much as it has been, and pending sales slipped thanks to the nasty weather.
Before we get into our detailed monthly stats, here’s a quick look at their press release.
Heavy Snowfall Ices February Housing Activity Around Western Washington
Seattle’s snowiest month in 50 years had an obvious chilling effect on February’s housing activity, agreed officials with Northwest Multiple Listing Service. Statistics for last month show pending sales dropped nearly 14 percent compared to the same month a year ago.“The winter weather brought the market to a halt,” stated John Deely, principal managing broker at Coldwell Banker Bain. He said last month’s series of snowstorms and frigid temperatures had a negative impact on the typical momentum that builds at the beginning of the year.
For once the used home salespeople actually have a good excuse. The once-a-decade snow storm in February definitely caused an unusual decline in the pending sales numbers. That will probably carry forward to March closed sales numbers.
NWMLS monthly reports include an undisclosed and varying number of
sales from previous months in their pending and closed sales statistics.
Here’s your King County SFH summary, with the arrows to show whether the year-over-year direction of each indicator is favorable or unfavorable news for buyers and sellers (green = favorable, red = unfavorable):
| February 2019 | Number | MOM | YOY | Buyers | Sellers |
|---|---|---|---|---|---|
| Active Listings | 2,850 | +1.1% | +109.7% |  |
 |
| Closed Sales | 1,417 | +15.8% | +1.0% |  |
 |
| SAAS (?) | 1.07 | -8.5% | -6.5% |  |
 |
| Pending Sales | 1,790 | -6.0% | -5.5% |  |
 |
| Months of Supply | 2.01 | -12.7% | +107.6% |  |
 |
| Median Price* | $655,000 | +7.4% | +0.8% |  |
 |
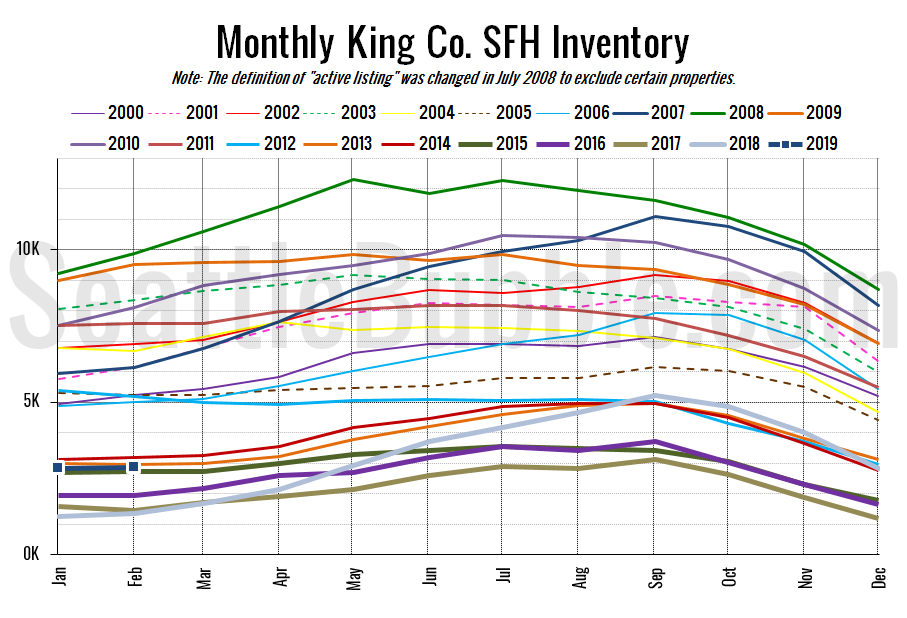
Here’s the graph of inventory with each year overlaid on the same chart.
Inventory was basically flat January to February, but thanks to the big gains in 2018 it was up 110 percent from last year. Sales seem to be starting to bounce back so I’m not sure we’ll see another year of big inventory gains in 2019. I hope we do.
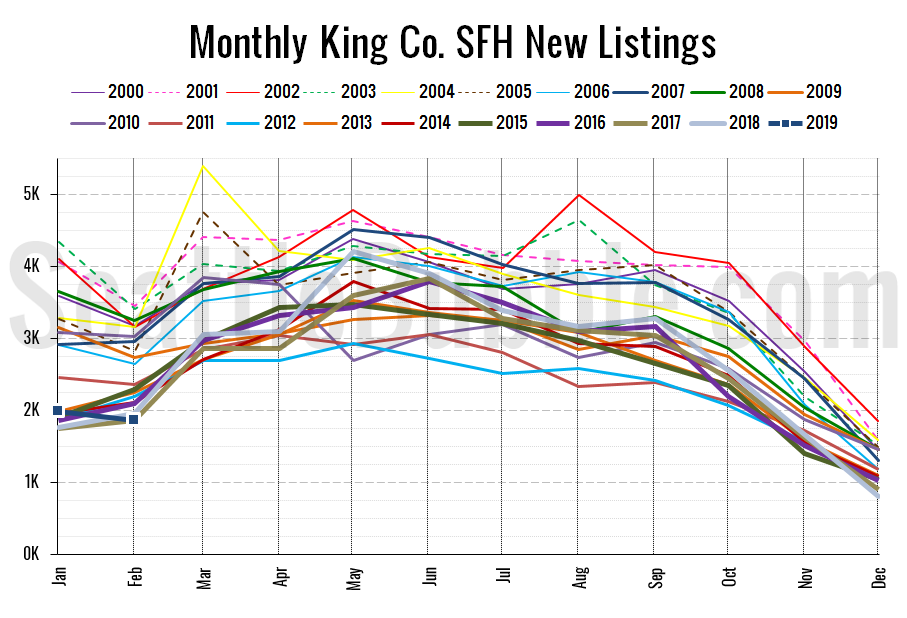
Here’s the chart of new listings:
New listings fell between January and February, and was down six percent from a year ago. I imagine that might be due to the snow storm as well. Hopefully we see the typical big spike in the March numbers.
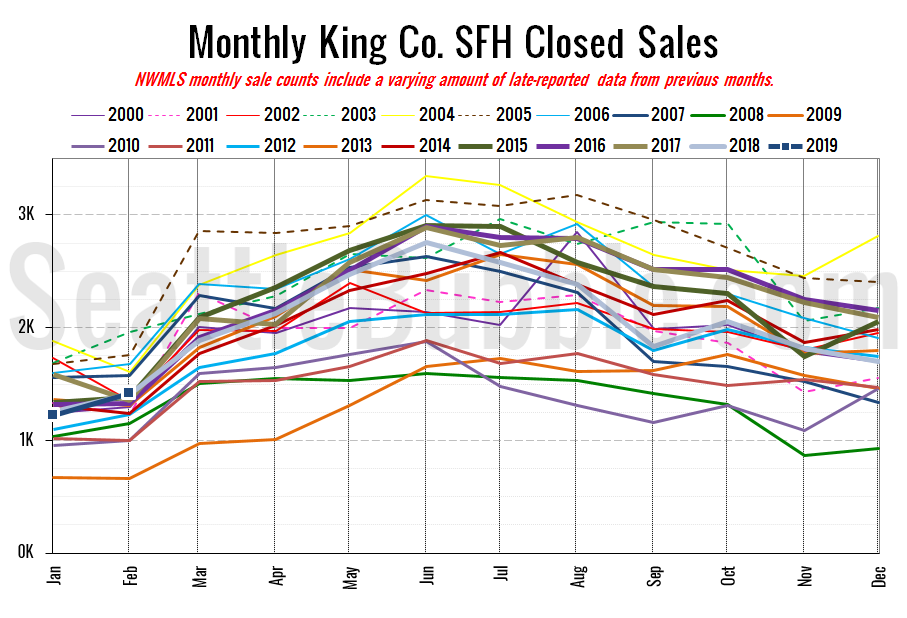
Here’s your closed sales yearly comparison chart:
Closed sales rose 16 percent between January and February, and turned in their first year-over-year gain since April 2018.
Pending sales fell six percent month-over-month and five percent year-over-year, but again that was probably mostly due to the two-week snow storm.
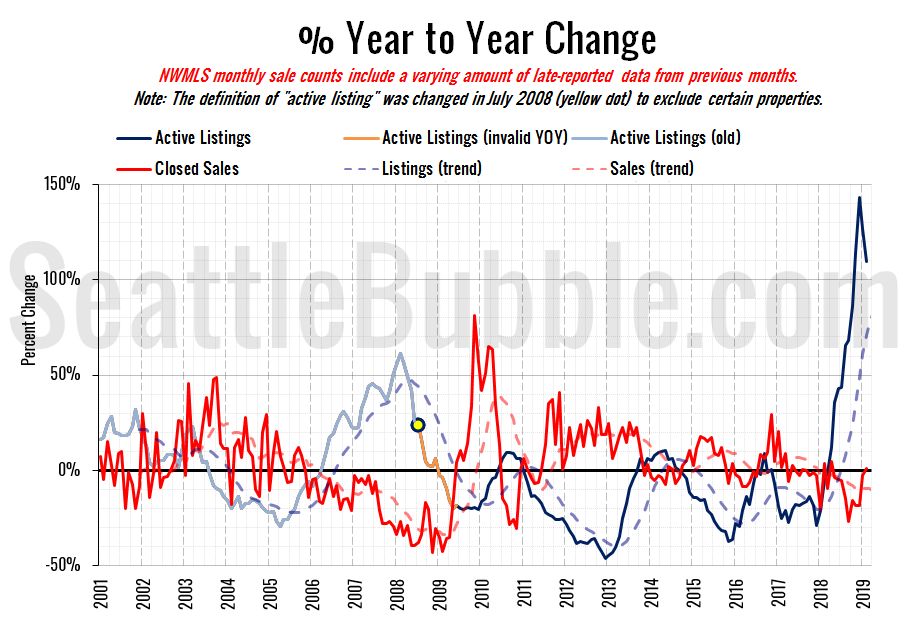
Here’s the supply/demand YOY graph. “Demand” in this chart is represented by closed sales, which have had a consistent definition throughout the decade (unlike pending sales from NWMLS).
It looks like the peak growth in inventory might be behind us now.
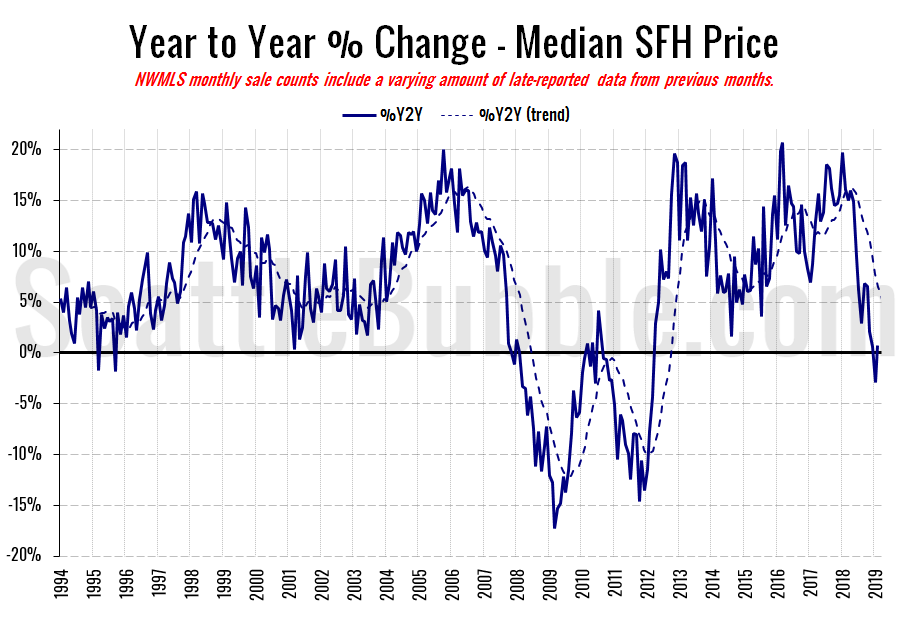
Here’s the median home price YOY change graph:
I did say last month that “I doubt we’ll see this continue to fall.” And sure enough, it ticked back into the black in February.
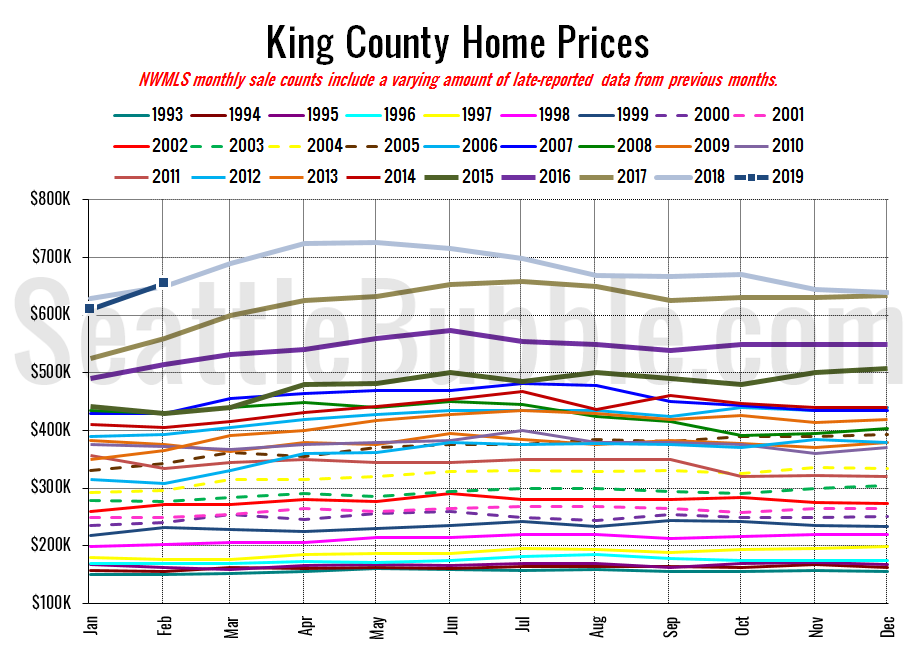
And lastly, here is the chart comparing King County SFH prices each month for every year back to 1994 (not adjusted for inflation).
February 2019: $655,000
February 2018: $649,950
July 2007: $481,000 (previous cycle high)
Here’s the article about these numbers from the Seattle Times: Market turnaround? King County home prices take biggest one-month jump ever
And here’s another good recent article from the Seattle Times that’s worth a read: With King County home prices picking up, are we in for another brutal spring for buyers? Maybe not
