Get access to the full spreadsheets used to make the charts in this and other posts, and support the ongoing work on this site by becoming a member of Seattle Bubble.
It’s been a few months since we had a look at the stats in the broader Puget Sound area, so let’s update our charts through March. Here’s the latest update to our “Around the Sound” statistics for King, Snohomish, Pierce, Kitsap, Thurston, Island, Skagit, and Whatcom counties.
First up, a summary table:
| March 2019 | King | Snohomish | Pierce | Kitsap | Thurston | Island | Skagit | Whatcom |
|---|---|---|---|---|---|---|---|---|
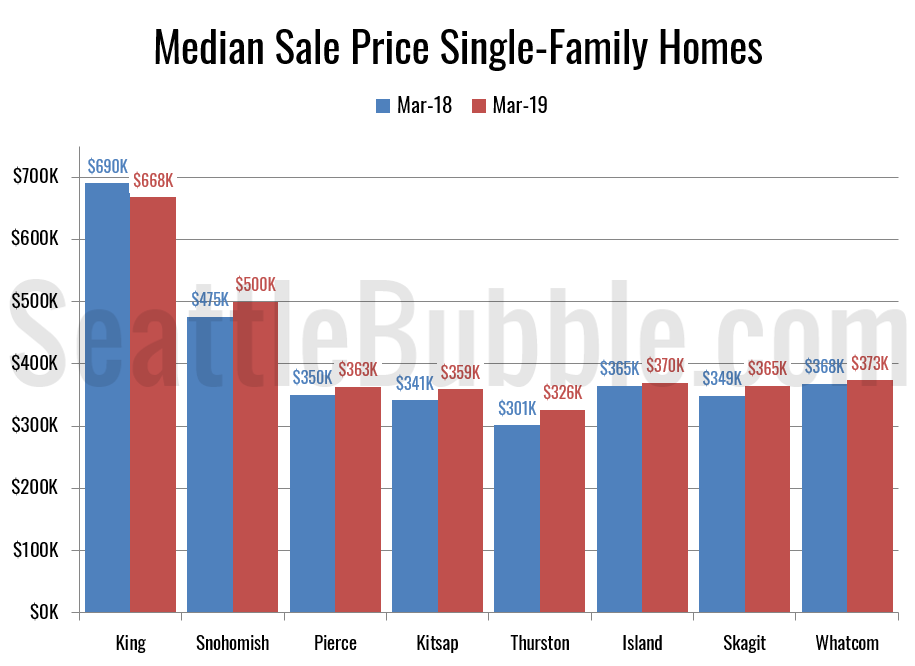
| Median Price | $667,725 | $500,000 | $363,084 | $359,200 | $325,550 | $370,000 | $364,950 | $373,450 |
| Price YOY | -3.2% | +5.3% | +3.8% | +5.2% | +8.2% | +1.4% | +4.7% | +1.5% |
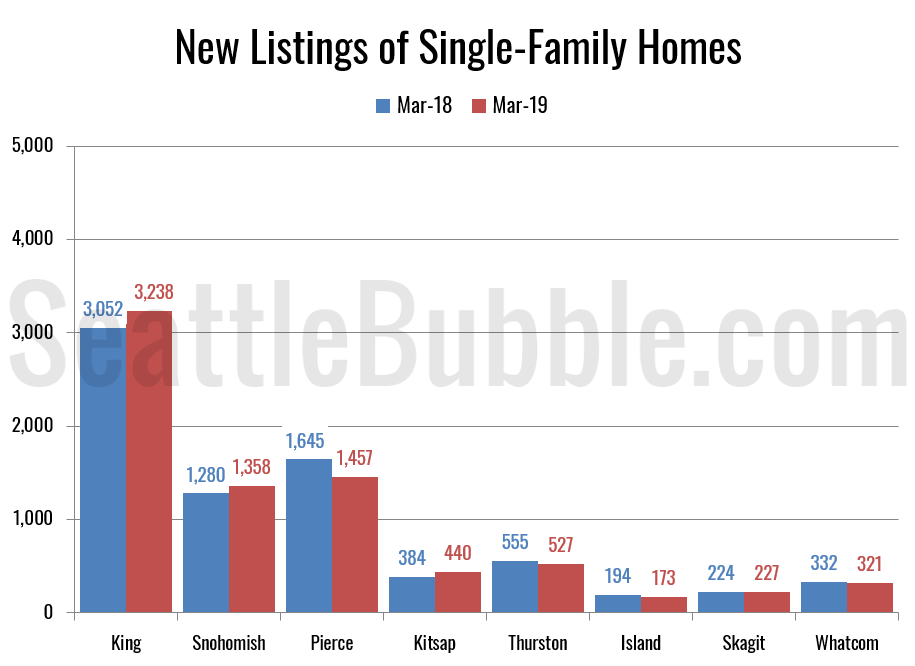
| New Listings | 3,238 | 1,358 | 1,457 | 440 | 527 | 173 | 227 | 321 |
| New Listings YOY | +6.1% | +6.1% | -11.4% | +14.6% | -5.0% | -10.8% | +1.3% | -3.3% |
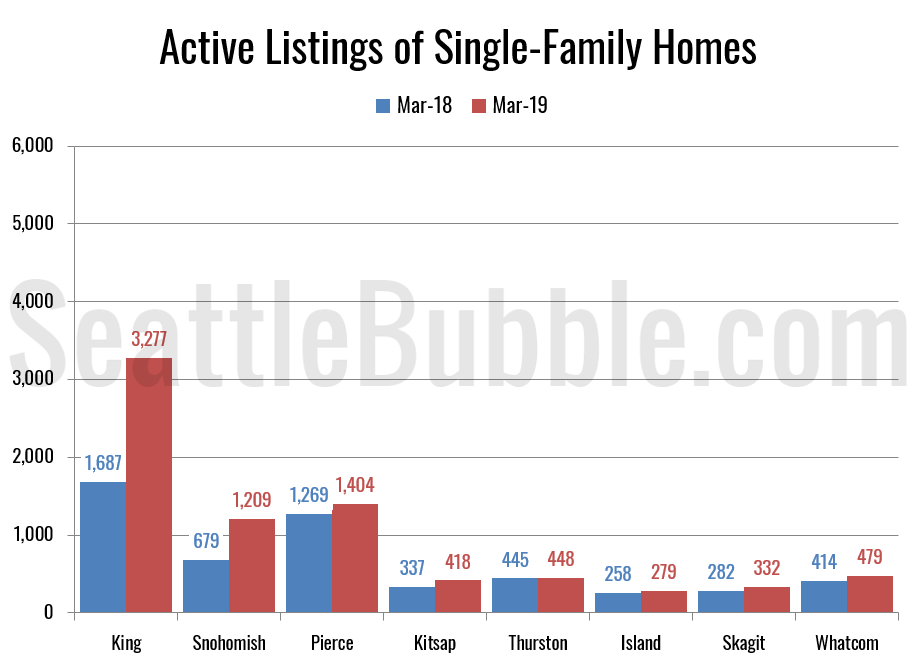
| Active Inventory | 3,277 | 1,209 | 1,404 | 418 | 448 | 279 | 332 | 479 |
| Inventory YOY | +94.3% | +78.1% | +10.6% | +24.0% | +0.7% | +8.1% | +17.7% | +15.7% |
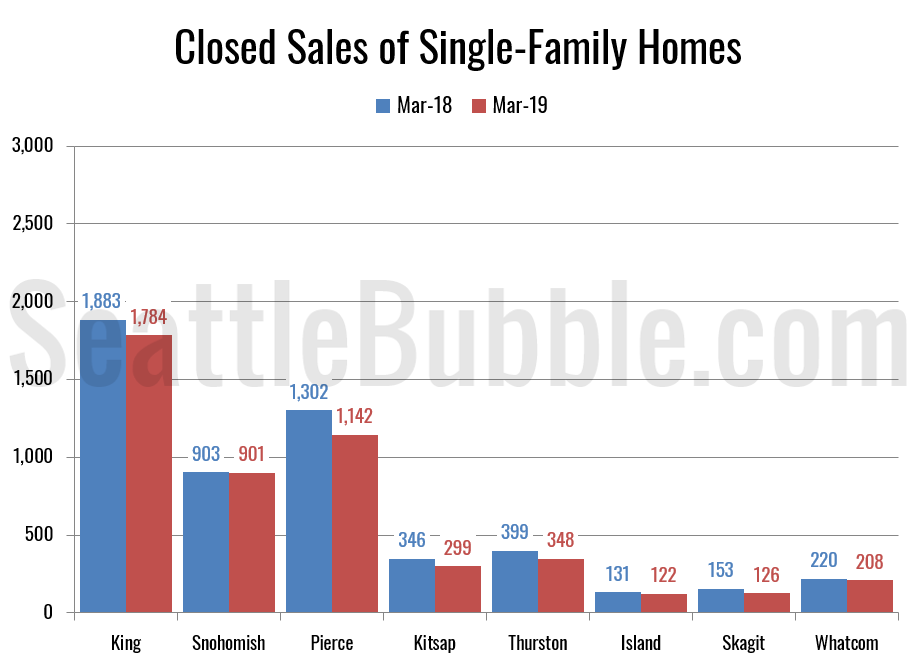
| Closed Sales | 1,784 | 901 | 1,142 | 299 | 348 | 122 | 126 | 208 |
| Sales YOY | -5.3% | -0.2% | -12.3% | -13.6% | -12.8% | -6.9% | -17.6% | -5.5% |
| Months of Supply | 1.8 | 1.3 | 1.2 | 1.4 | 1.3 | 2.3 | 2.6 | 2.3 |
King County still has some of the most dramatic changes, as the only county with a drop in the median price and by far the biggest increase in active listings. That said, active listings are up and closed sales are down across the board. Skagit, Kitsap, Pierce, and Thurston all still saw double-digit year-over-year declines in sales.
Here’s a look at new listings across the region:
New listings were up the most in Kitsap County, which saw 15 percent more listing than a year earlier. Listings were also up in King, Snohomish, and Skagit, but fell in Pierce, Island, and Whatcom.
Next up: Active inventory.
Inventory was up everywhere, but only just barely in Thurston, which saw an increase of less than one percent from a year earlier. Island was the second-smallest gain at eight percent. Every other county saw at least double-digit increases in inventory from March 2018.
Here’s the chart of median prices compared to a year ago.
Prices were up everywhere but King County, with the biggest gains in Thurston County, up eight percent.
Closed sales fell in every county, but only just barely in Snohomish. King and Whatcom counties were down five percent and Island fell seven percent. Every other county saw double-digit decreases in closed sales.
Every county is still deep in sellers’ market territory, but at least they’re all improving from a year ago.
If there is certain data you would like to see or ways you would like to see the data presented differently, drop a comment below and let me know.


