Get access to the full spreadsheets used to make the charts in this and other posts, as well as a variety of additional insider benefits by becoming a member of Seattle Bubble.
October market data from the NWMLS is available. Here’s what happened last month in the Seattle-area housing market: Home prices and pending sales fell slightly, but closed sales rose to the highest level ever seen during an October—over 3,000 sales. The previous record for closed sales during an October was 2,922 sales in 2003. October this year saw 20% more sales than the highest October level in the last ten years (2,514 in 2016).
Obviously the pandemic and recession is having virtually zero impact on homebuying demand.
I haven’t yet seen a press release from the NWMLS, so let’s just get into the data.
NWMLS monthly reports include an undisclosed and varying number of
sales from previous months in their pending and closed sales statistics.
Here’s your King County SFH summary, with the arrows to show whether the year-over-year direction of each indicator is favorable or unfavorable news for buyers and sellers (green = favorable, red = unfavorable):
| October 2020 | Number | MOM | YOY | Buyers | Sellers |
|---|---|---|---|---|---|
| Active Listings | 2,258 | -6.7% | -37.6% |  |
 |
| Closed Sales | 3,027 | +6.3% | +36.0% | |
|
| SAAS (?) | 1.02 | -7.0% | -4.7% | |
|
| Pending Sales | 3,007 | -9.6% | +16.0% | |
|
| Months of Supply | 0.75 | -12.2% | -54.2% | |
|
| Median Price* | $745,000 | -1.1% | +12.9% | |
|
Here’s the graph of inventory with each year overlaid on the same chart.

Inventory fell 6.7 percent from September to October, and was down 38 percent from last year. We still haven’t hit the all-time low point for the number of homes on the market, and the trend seems to be flatlining somewhat, so we may not hit that point this winter.
Here’s the chart of new listings:

Good news again for new listings, which were up 30 percent from a year ago. This October saw more new listings than any October since 2007.
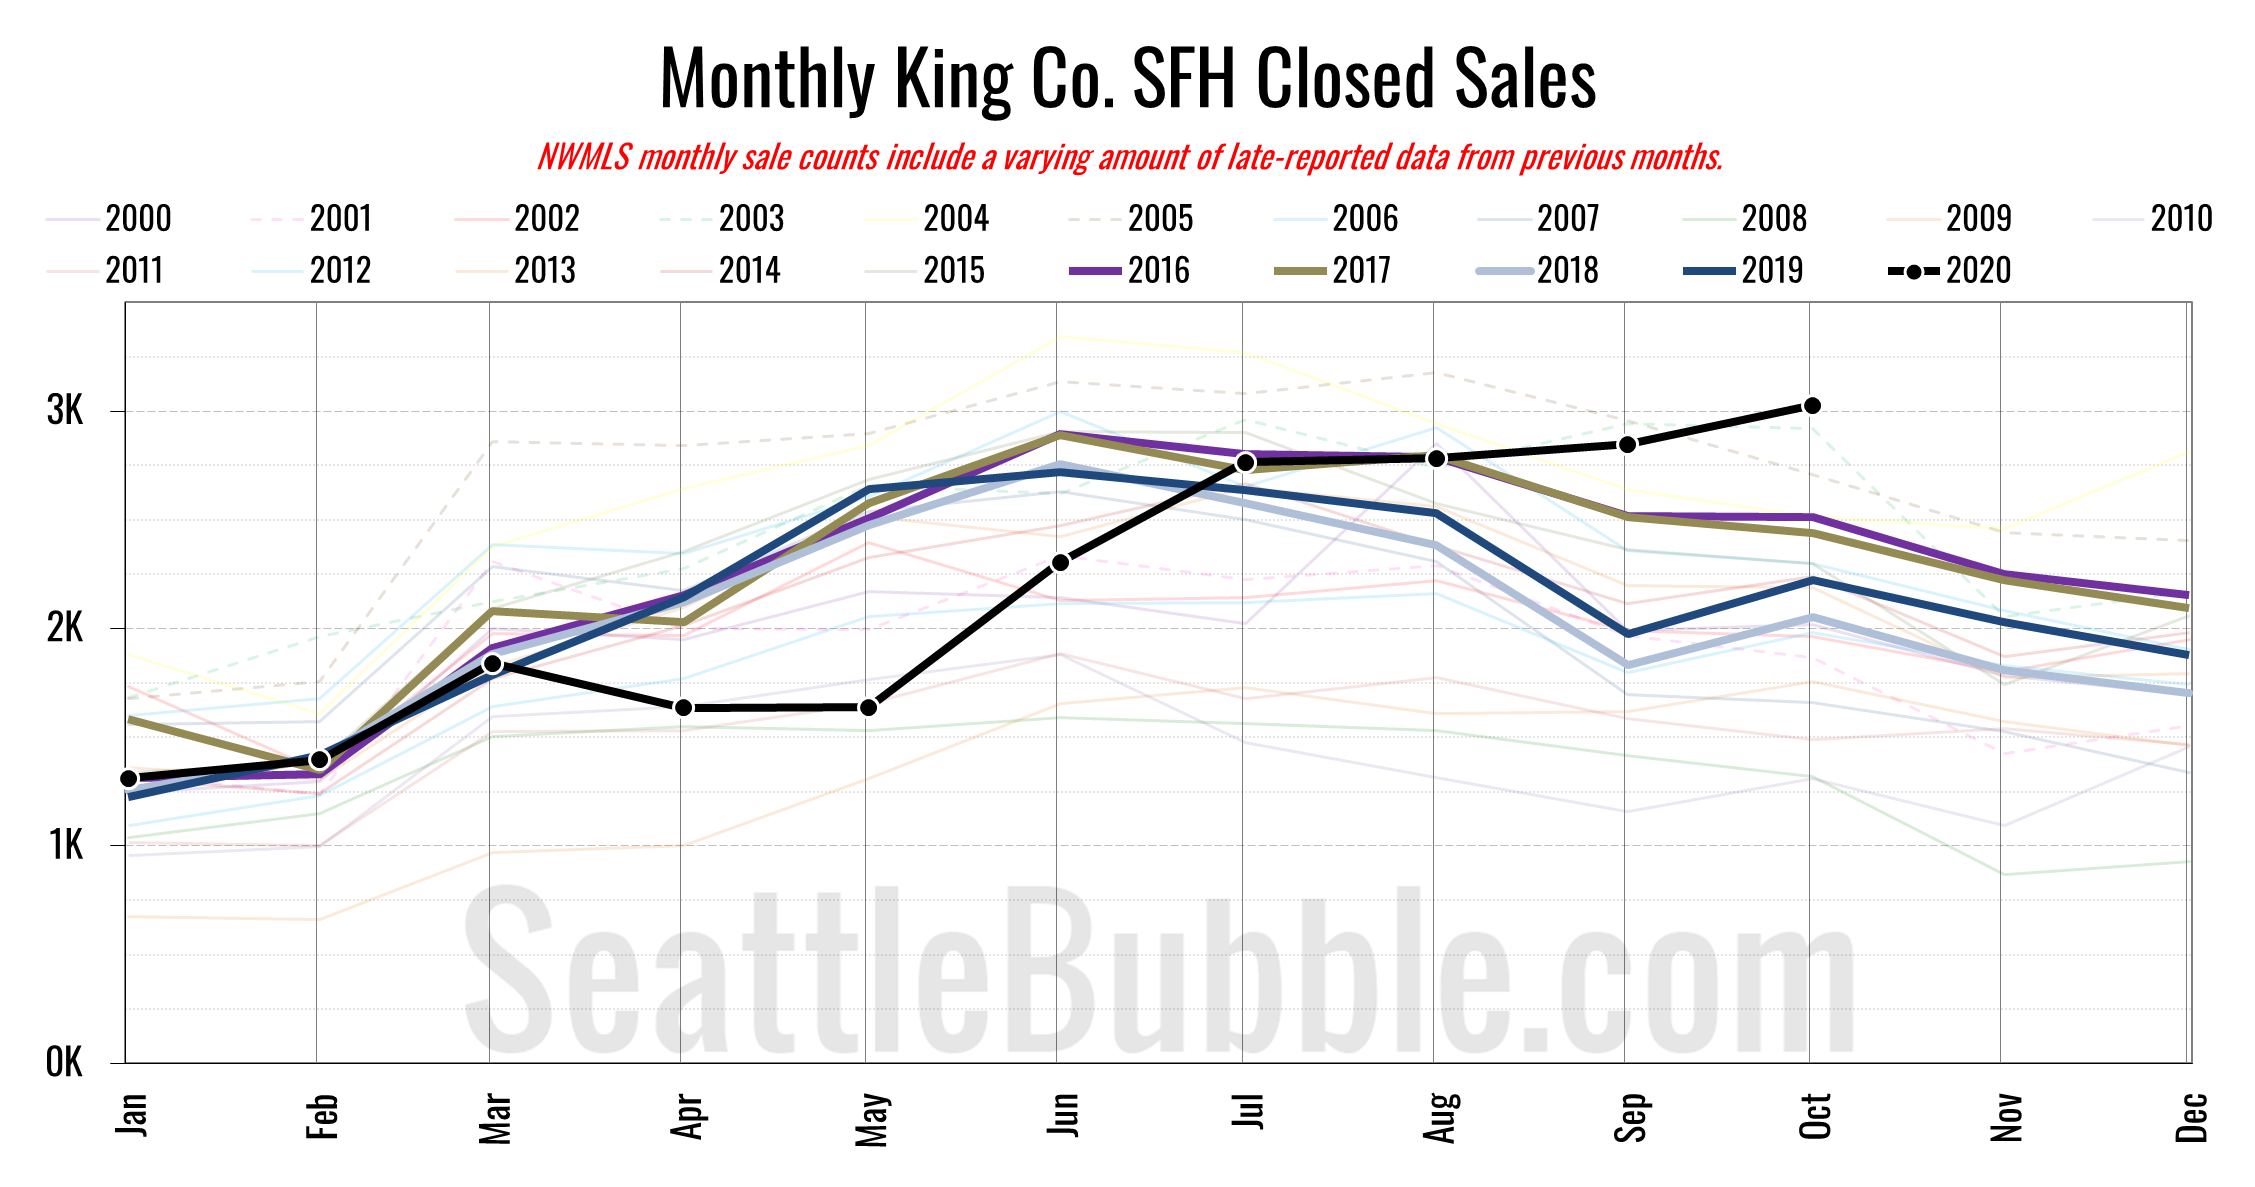
Here’s your closed sales yearly comparison chart:

Closed sales rose from September to October, which is not uncommon, but the 6 percent increase was enough to make it the largest October on record for closed sales. Year-over-year closed sales were up 36 percent.

Pending sales fell 10 percent from September to October, and were up 16 percent year-over-year.
Here’s the supply/demand YOY graph. “Demand” in this chart is represented by closed sales, which have had a consistent definition throughout the decade (unlike pending sales from NWMLS).

Still not a pretty picture for homebuyers, with demand sharply rising and supply still falling. At least the rate of decline in home supply is stabilizing.
Here’s the median home price YOY change graph:

Year-over-year home price changes have been in the double digits for three months in a row now, gaining 13% in October.
And lastly, here is the chart comparing King County SFH prices each month for every year back to 1994 (not adjusted for inflation).

October 2019: $660,000
October 2020: $745,000
July 2007: $481,000 (previous cycle high)