Get access to the full spreadsheets used to make the charts in this and other posts, and support the ongoing work on this site by becoming a member of Seattle Bubble.
Let’s take a look at our stats for the local regions outside of the King/Snohomish core. Here’s your October update to our “Around the Sound” statistics for Pierce, Kitsap, Thurston, Island, Skagit, and Whatcom counties.
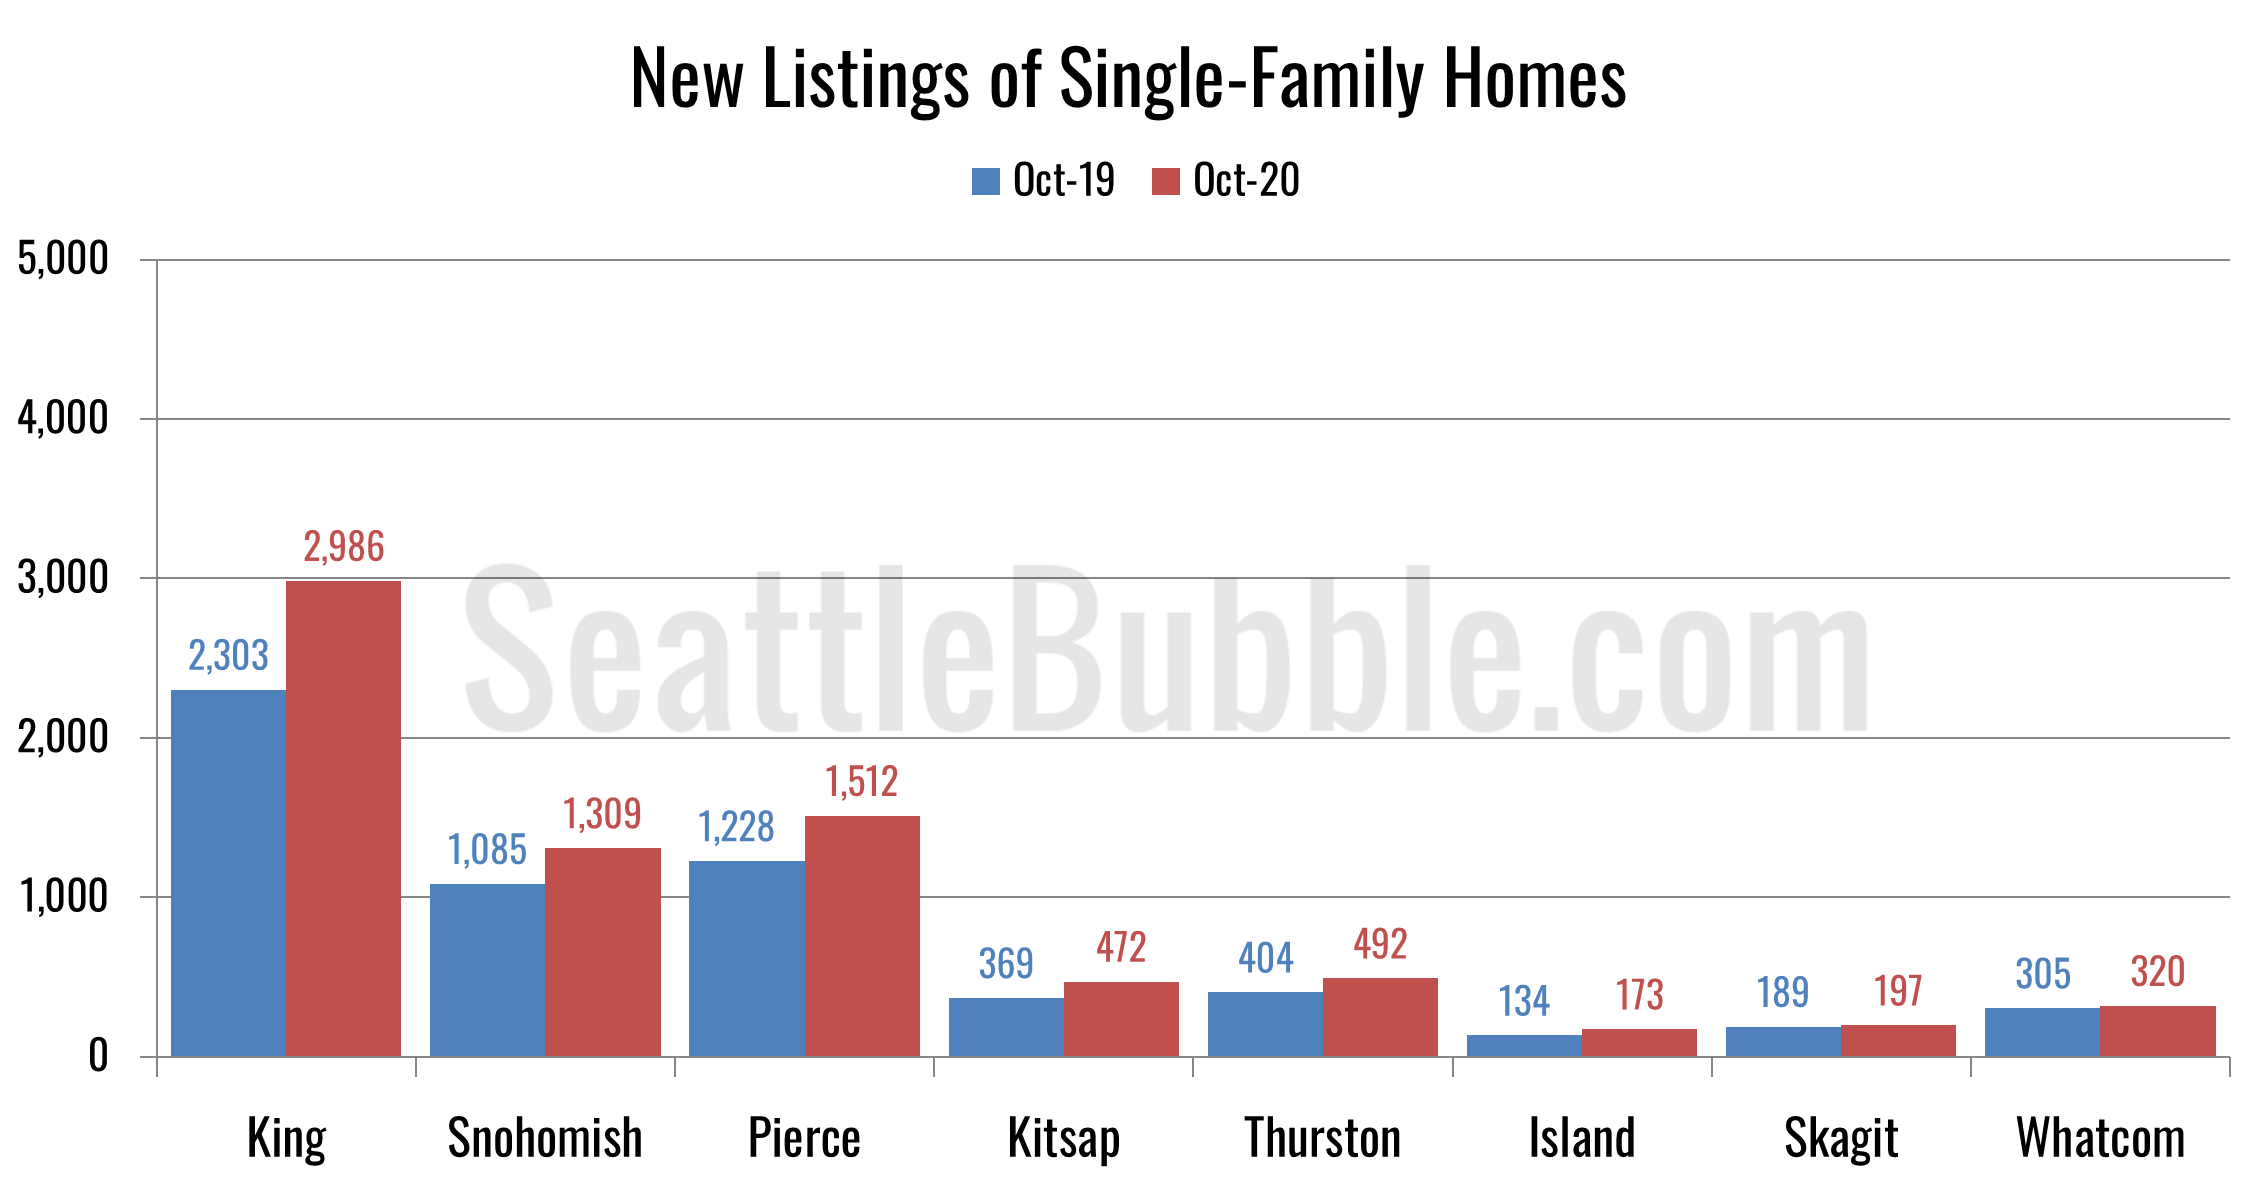
Things are looking pretty similar all around the Puget Sound region—extremely low supply, high demand, and skyrocketing prices. The one tiny bright spot for buyers is that new listings are higher than they were a year ago in every county.
First up, a summary table:
| October 2020 | King | Snohomish | Pierce | Kitsap | Thurston | Island | Skagit | Whatcom |
|---|---|---|---|---|---|---|---|---|
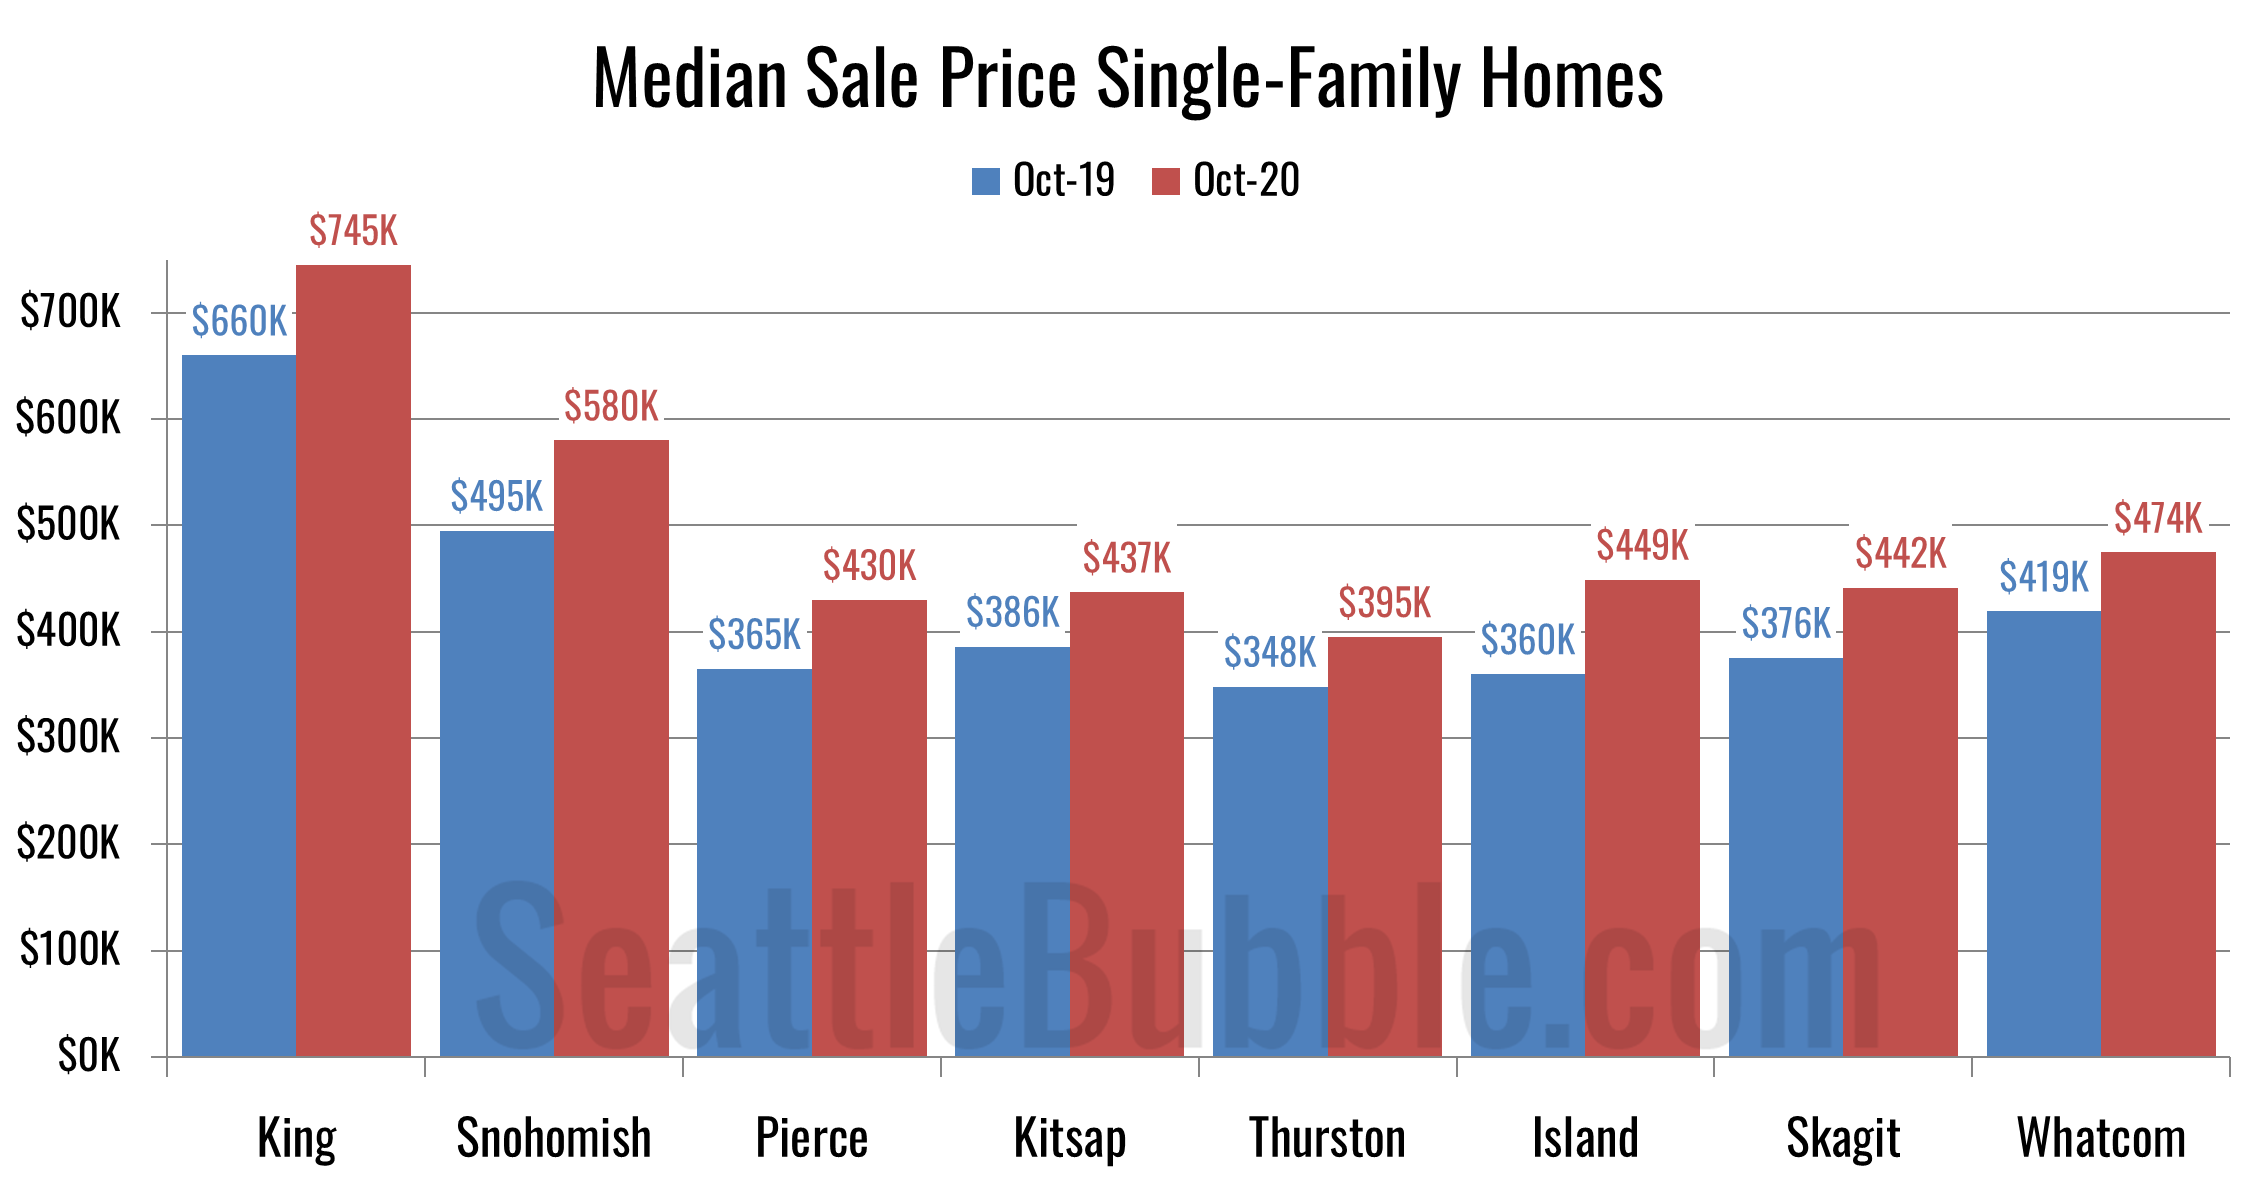
| Median Price | $745,000 | $579,972 | $430,000 | $437,000 | $395,000 | $449,000 | $441,500 | $474,450 |
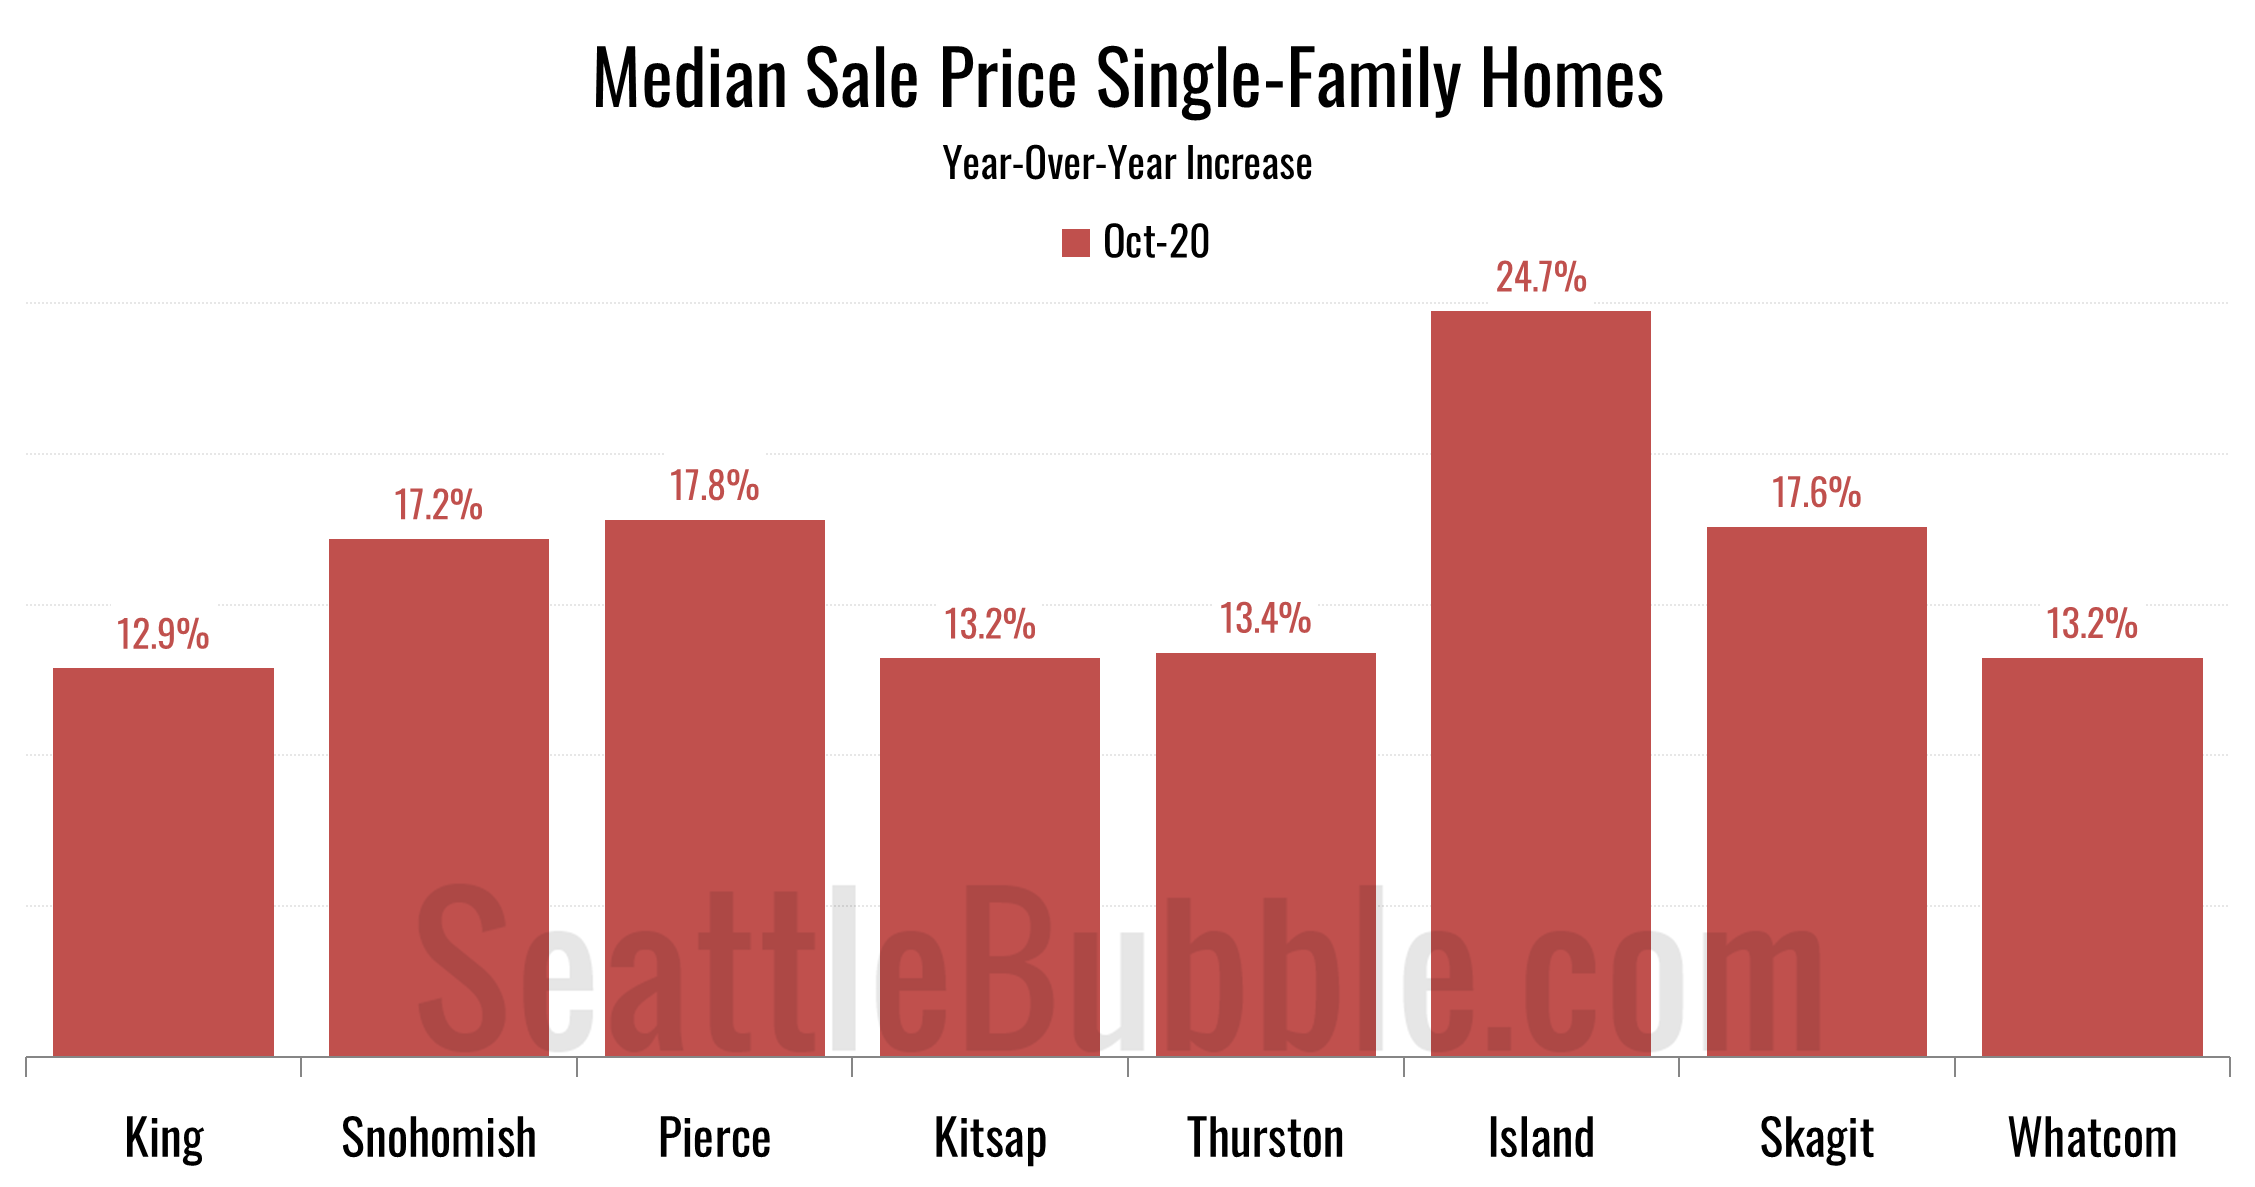
| Price YOY | 12.9% | 17.2% | 17.8% | 13.2% | 13.4% | 24.7% | 17.6% | 13.2% |
| New Listings | 2,986 | 1,309 | 1,512 | 472 | 492 | 173 | 197 | 320 |
| New Listings YOY | 29.7% | 20.6% | 23.1% | 27.9% | 21.8% | 29.1% | 4.2% | 4.9% |
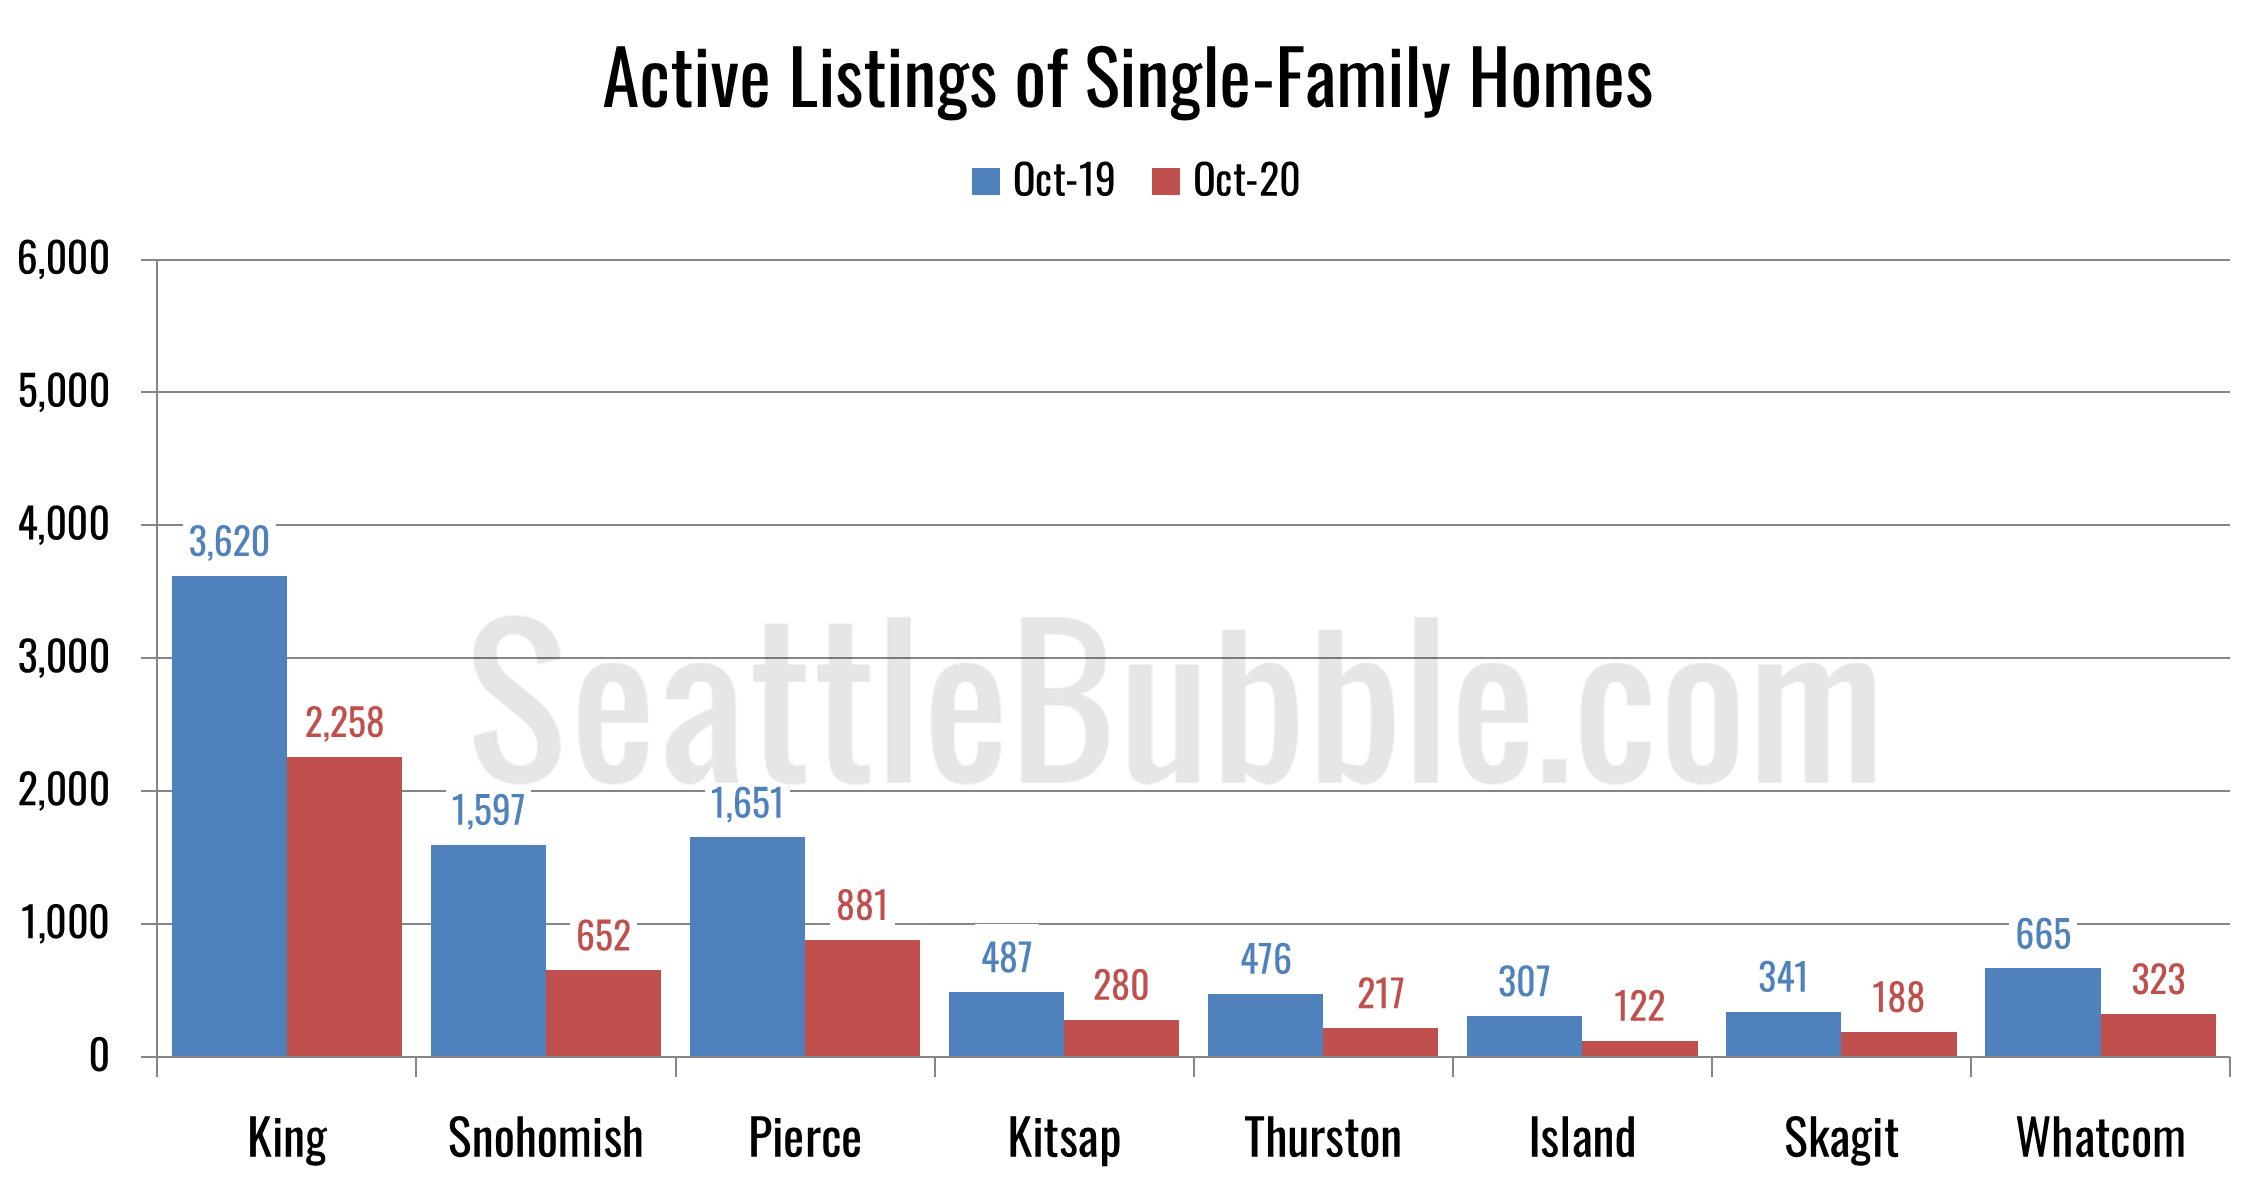
| Active Listings | 2,258 | 652 | 881 | 280 | 217 | 122 | 188 | 323 |
| Active YOY | -37.6% | -59.2% | -46.6% | -42.5% | -54.4% | -60.3% | -44.9% | -51.4% |
| Pending Sales | 3,007 | 1,403 | 1,658 | 524 | 549 | 182 | 219 | 331 |
| Pending YOY | 16.0% | 12.4% | 11.2% | 10.3% | 11.8% | 16.7% | -0.5% | 2.2% |
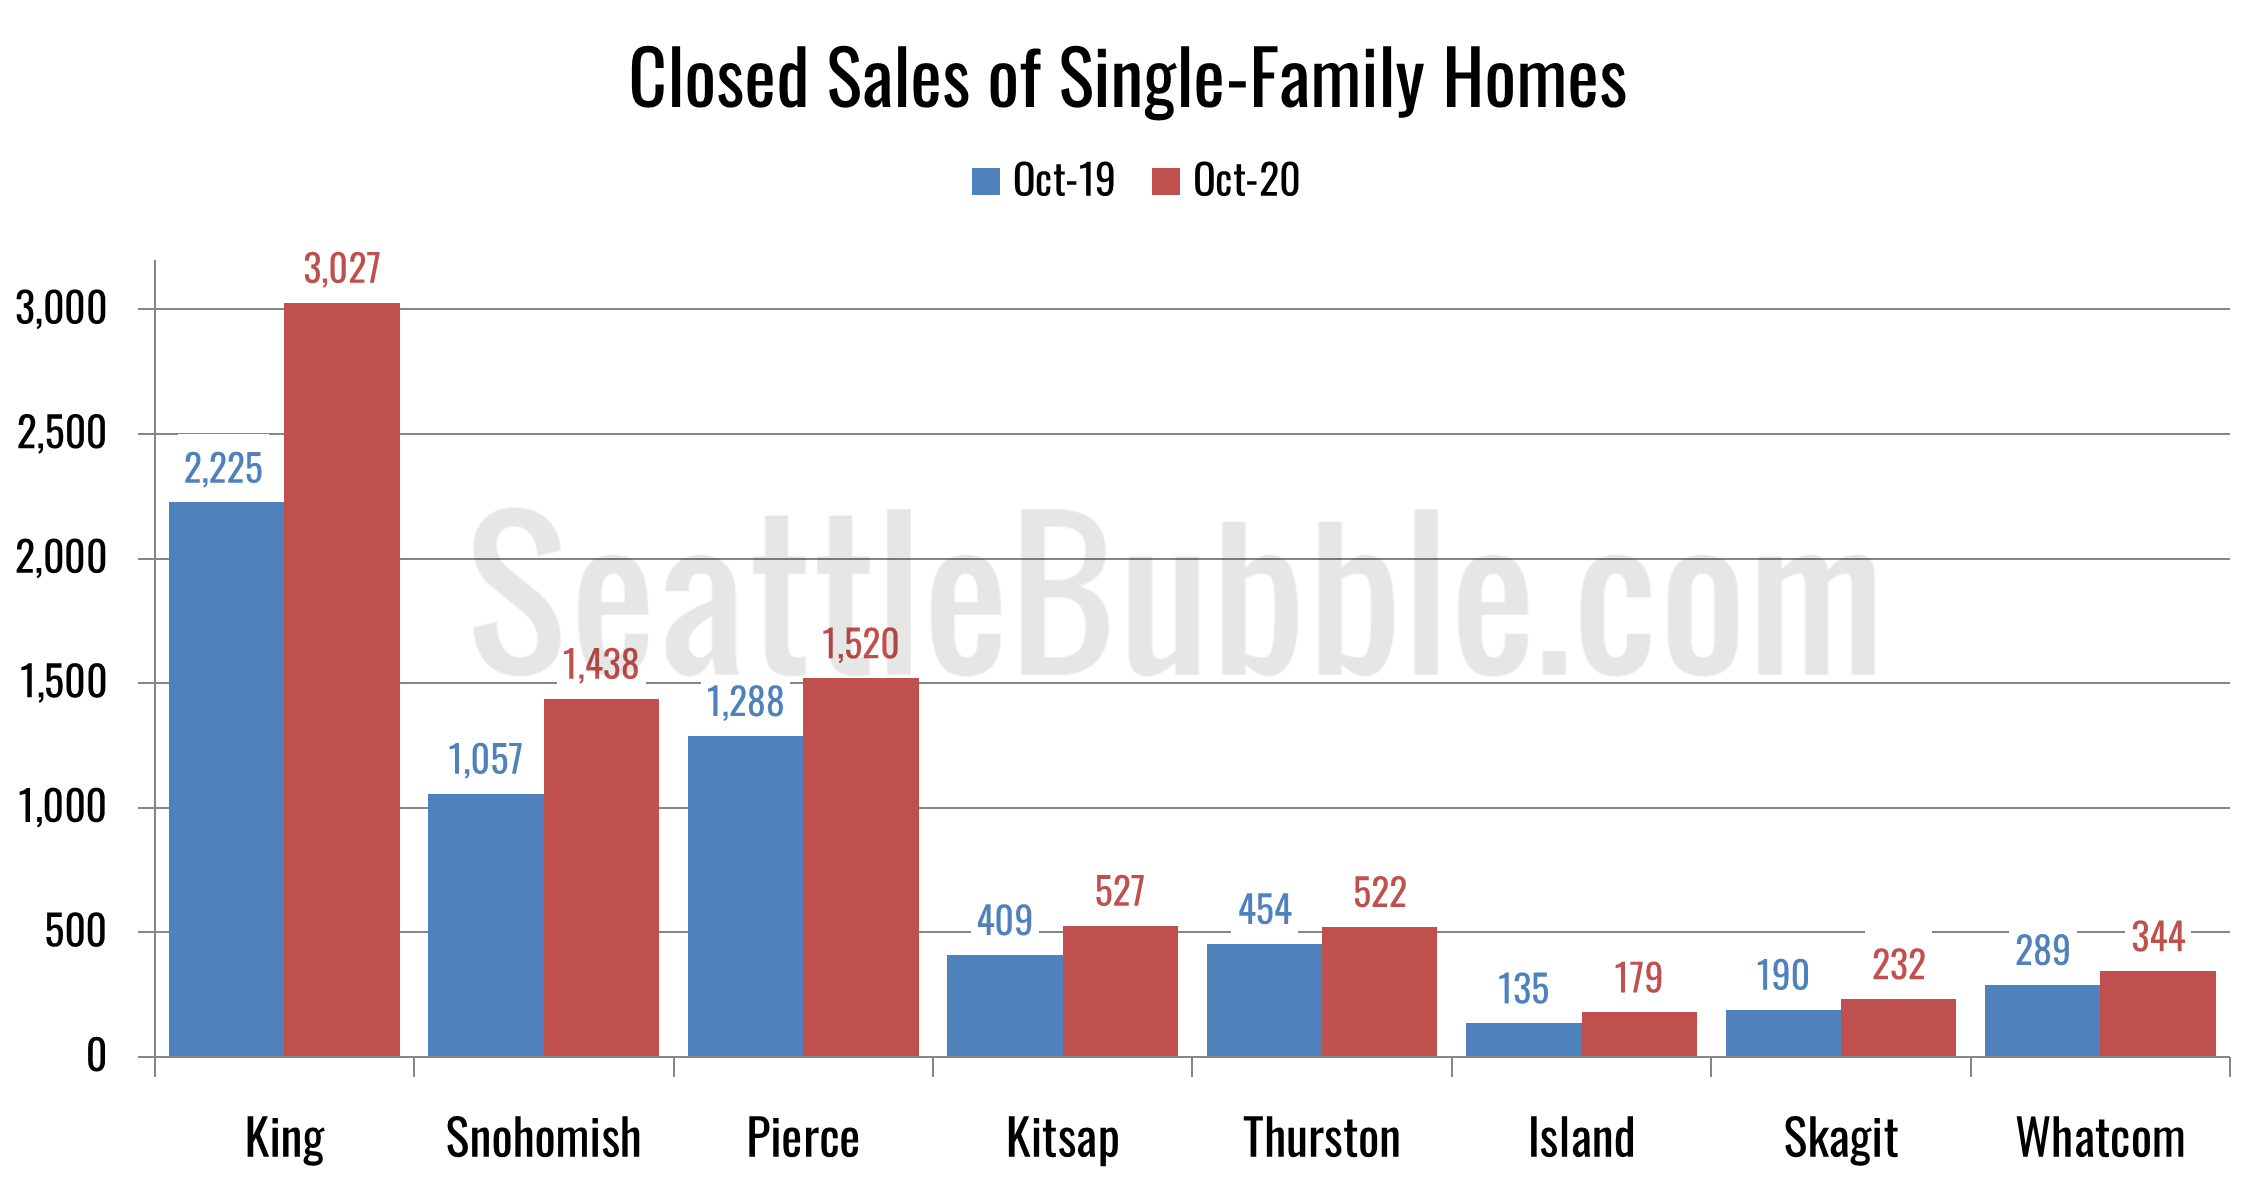
| Closed Sales | 3,027 | 1,438 | 1,520 | 527 | 522 | 179 | 232 | 344 |
| Closed YOY | 36.0% | 36.0% | 18.0% | 28.9% | 15.0% | 32.6% | 22.1% | 19.0% |
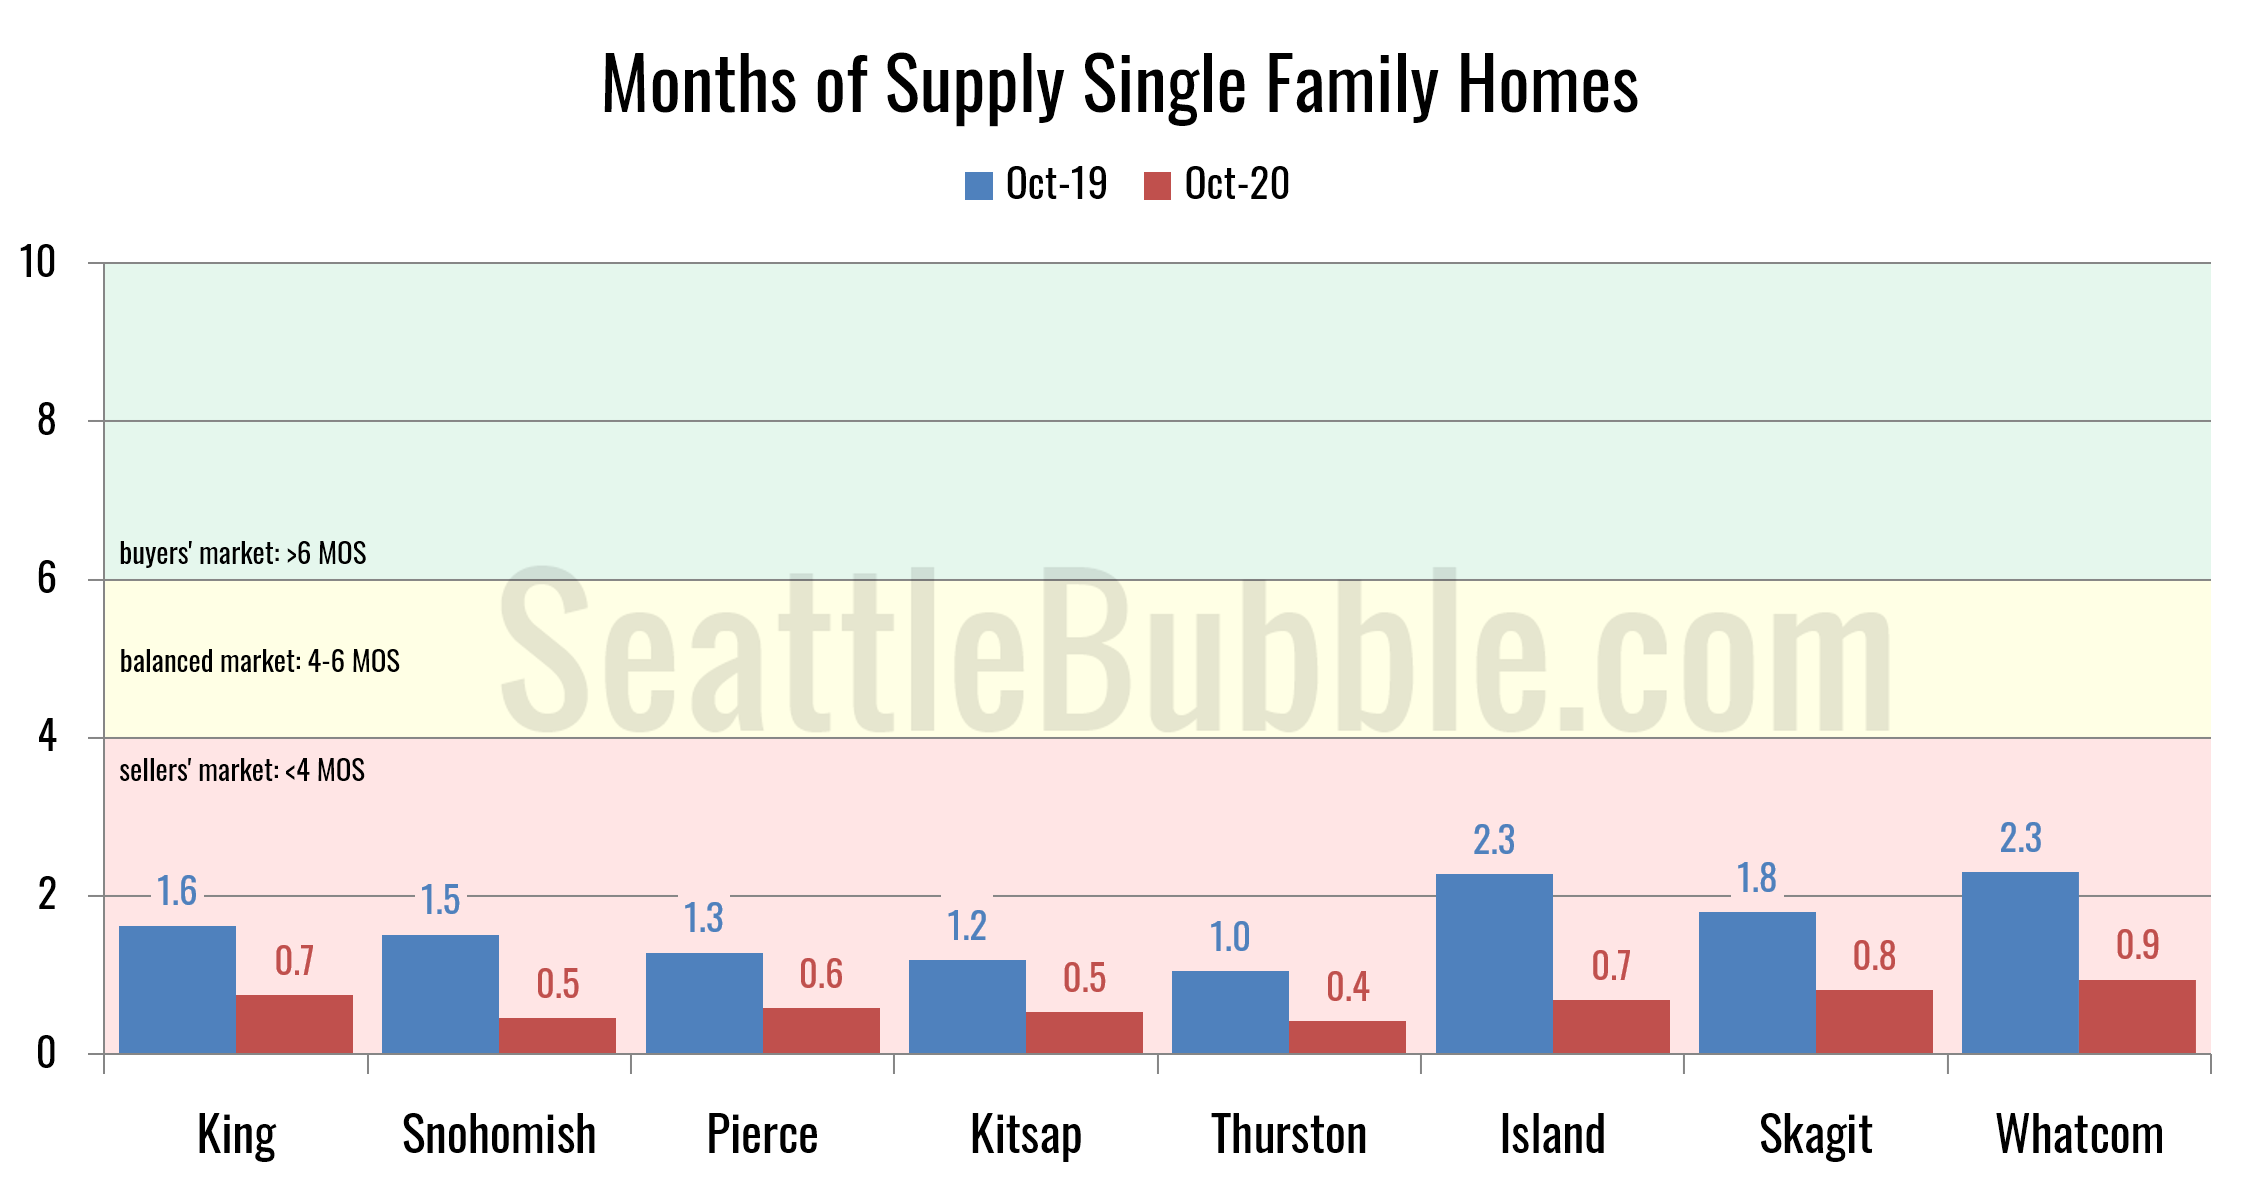
| Months of Supply | 0.7 | 0.5 | 0.6 | 0.5 | 0.4 | 0.7 | 0.8 | 0.9 |
Median home prices were up in every single county from a year earlier. King County’s 13 percent increase was actually the smallest around the sound, while the largest price gains were in Island County.
Here’s the one sort-of bright spot for buyers: New listings are on the rise, especially in King County.
However, active listings are down dramatically from a year ago in every county. The biggest decline was in Island County (probably no surprise then that prices are up the most there), where listings fell by 60 percent from a year earlier. King County saw the smallest drop, but was still down 38 percent.
Closed sales were up across the board in every single county. The biggest gains were in King and Snohomish Counties, which both saw closed sales increase 36 percent from a year ago. Pierce and Thurston had the smallest gains at 18 percent and 15 percent, respectively.
Months of supply is just absolutely abysmal for buyers everywhere. Every single county less than one month of supply in October.
In summary: It’s still a pretty terrible time to be a home buyer, across the entire Greater Seattle Area.
If there is certain data you would like to see or ways you would like to see the data presented differently, drop a comment below and let me know.
