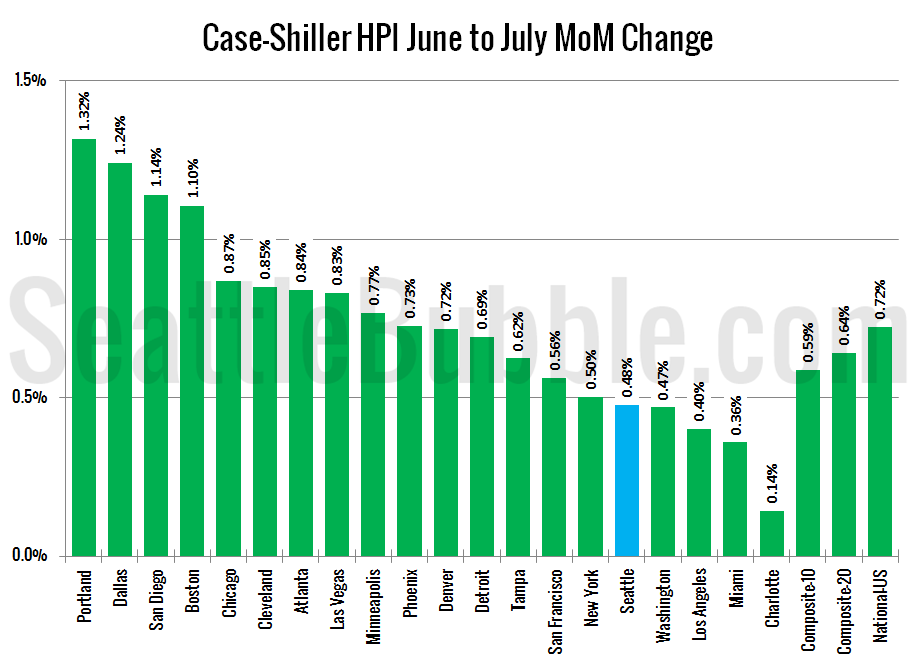
Let’s have a look at the latest data from the Case-Shiller Home Price Index. According to July data, Seattle-area home prices were:
Up 0.5% June to July
Up 7.3% YOY.
Down 4.7% from the July 2007 peak
…
local real estate news, statistics, and commentary without the sales spin.
Let’s have a look at the latest data from the Case-Shiller Home Price Index. According to July data, Seattle-area home prices were:
Up 0.5% June to July
Up 7.3% YOY.
Down 4.7% from the July 2007 peak
…
Here’s a fun Friday Flashback. How many of my readers remember this classic 2006 Century 21 TV commercial?
“Suzanne Researched This” became a big inside joke among those who didn’t buy the hype at the peak of the bubble. This commercial was so egregious that even Slate wrote an article headlined “The Nastiest Wife on Television.”
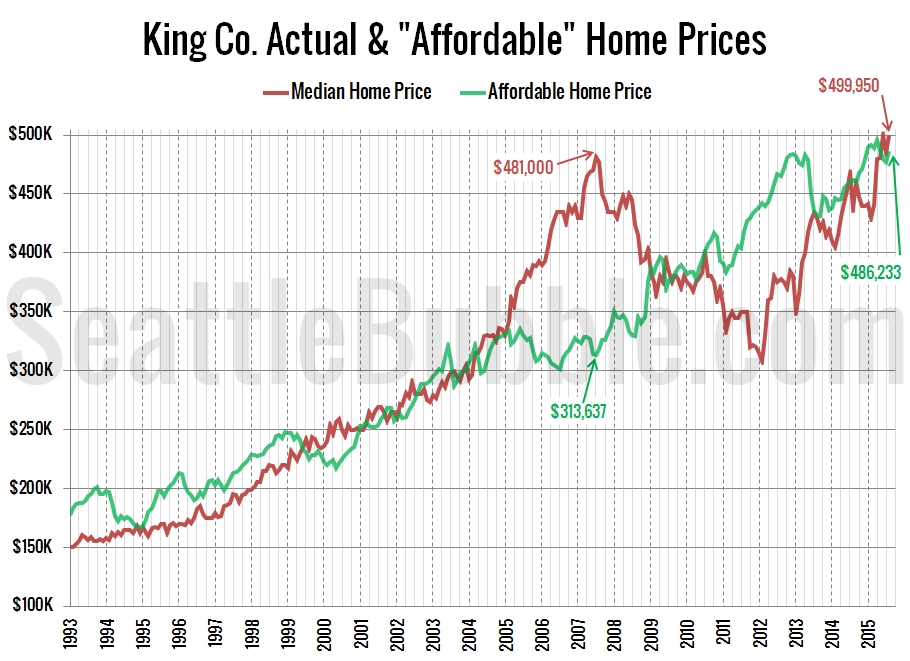
Here’s an updated look at the “affordable home” price chart.
In this graph I flip the variables in the affordability index calculation around to other sides of the equation to calculate what price home the a family earning the median household income could afford to buy at today’s mortgage rates if they put 20% down and spent 30% of their monthly income.
The “affordable” home price hit $496,051 back in April, but has since dropped off…
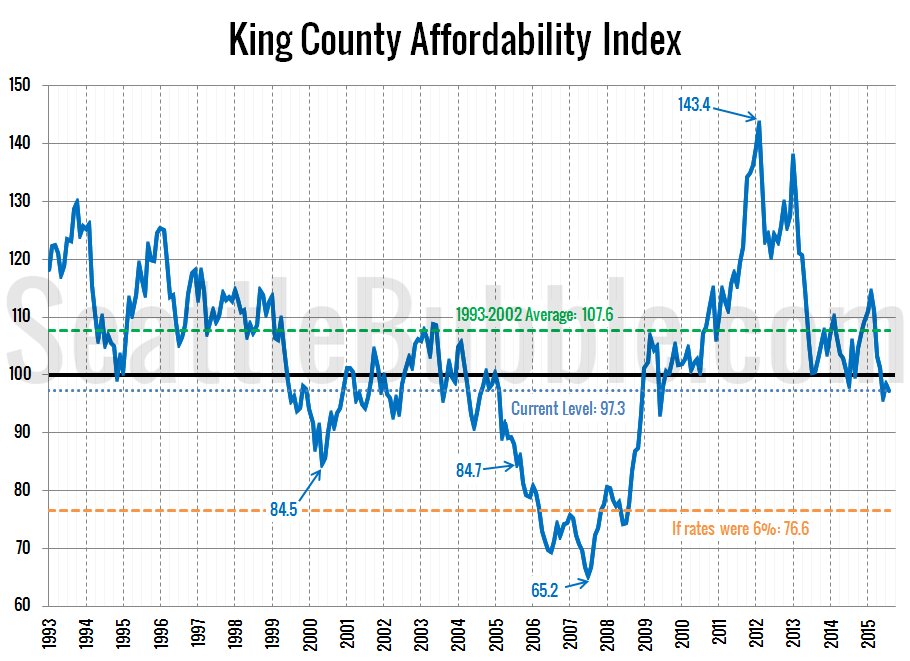
Don’t forget, you can get access to the spreadsheets used to make the charts in this and other posts by becoming a member of Seattle Bubble. It’s been a few months since we took a look at the local affordability index. So, let’s have a new look at all of our affordability index charts. As…
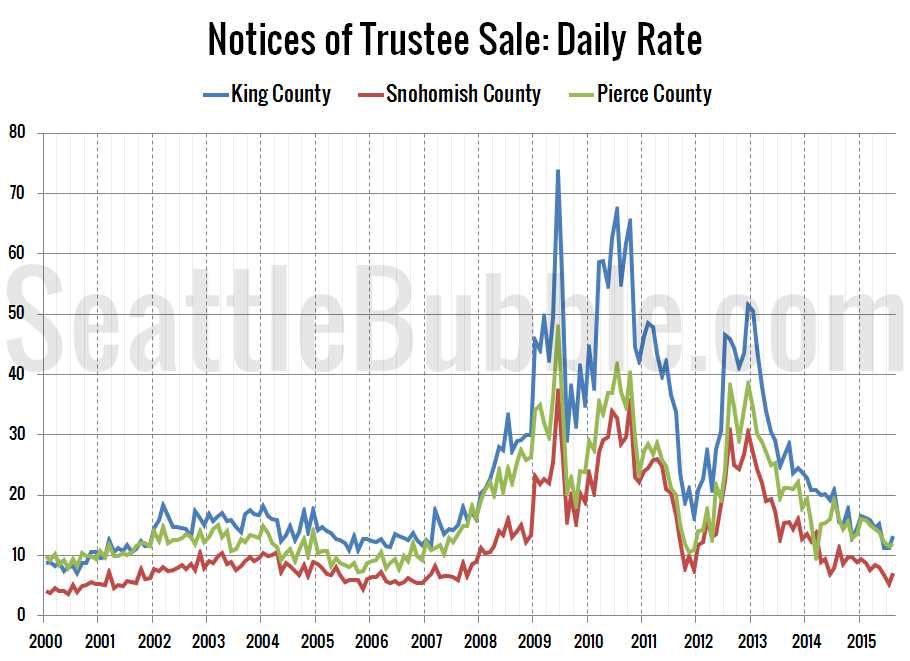
Get access to the full spreadsheets used to make the charts in this and other posts by becoming a member of Seattle Bubble. It’s been a few months since we took a detailed look at foreclosure stats in King, Snohomish, and Pierce counties, so let’s update those numbers. First up, the Notice of Trustee Sale…