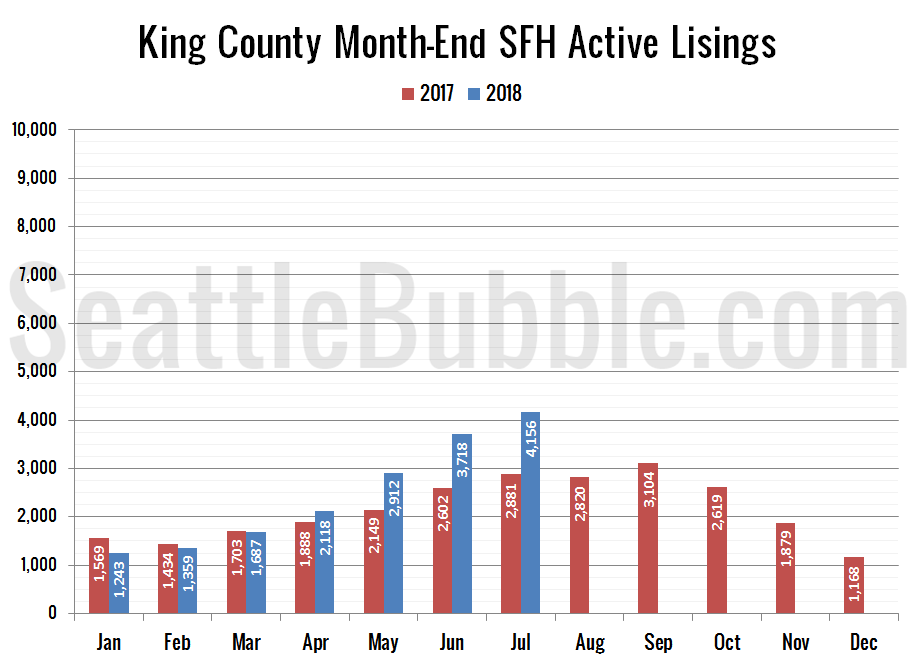
July market stats were published by the NWMLS yesterday. The biggest news is still the climb in inventory, which is up 256 percent from the all-time low that was set back in December. If the current trend continues (a big “if”), it’s entirely possible that by the end of this year inventory will be at its highest point since 2011.
Category: Counties
County-wide statistics.
July Stats Preview: The 2018 Listings Surge Continues
The 2018 listings surge continued in July, with on-market single-family inventory hitting its highest level since October 2013.
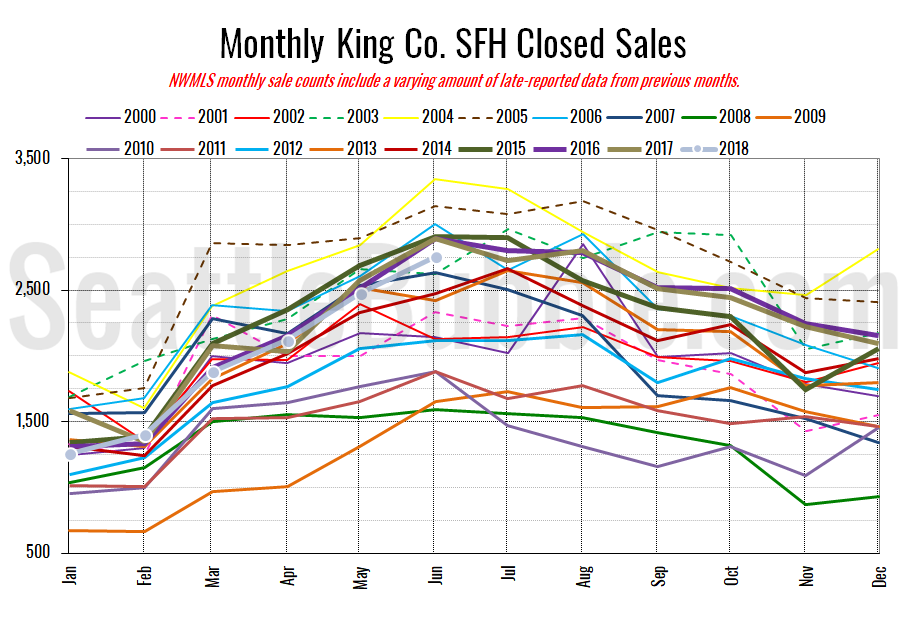
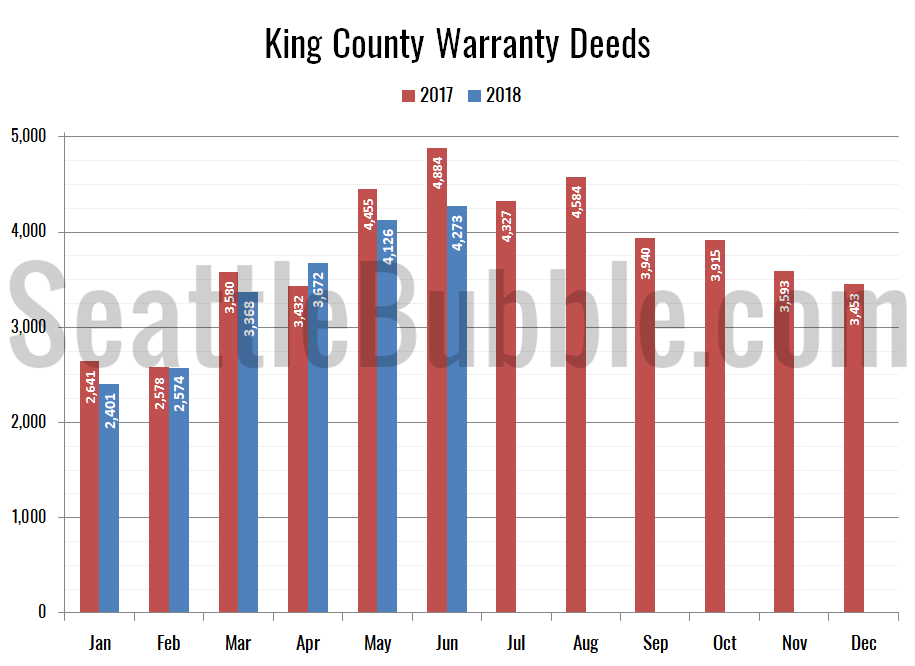
Here’s the overall summary for July: Sales fell both month-over-month and year-over-year. Listings shot up yet again. Foreclosures are still at all-time lows.
NWMLS: Listings surge as sales and prices soften a bit
The big news in this month’s numbers is yet again the big bump in total on-market inventory. That said, prices look like they’re beginning to soften as well, which is unusual for what is normally the hottest time of year for price gains.
Inventory rose twenty-eight percent from May to June, and was up forty-three percent from last year. We’re definitely forming an interesting trend now. This year has seen listings building up a lot faster than any recent year. Meanwhile, sales are softening…
June Stats Preview: Listings surge even higher in June
Last month we noticed a big surge in listings in King County in our preview data for May, and in June it looks like the trend is getting stronger. On-market listings of single-family homes nearly hit their highest point in four years in June, surging 28 percent in a single month.
The overall summary for June is that sales edged up from May, but saw the biggest year-over-year decline since April 2011. Listings shot up and are starting to form a very interesting trend. Foreclosures are still few and far between.
Case-Shiller: Seattle’s streak on top continues…
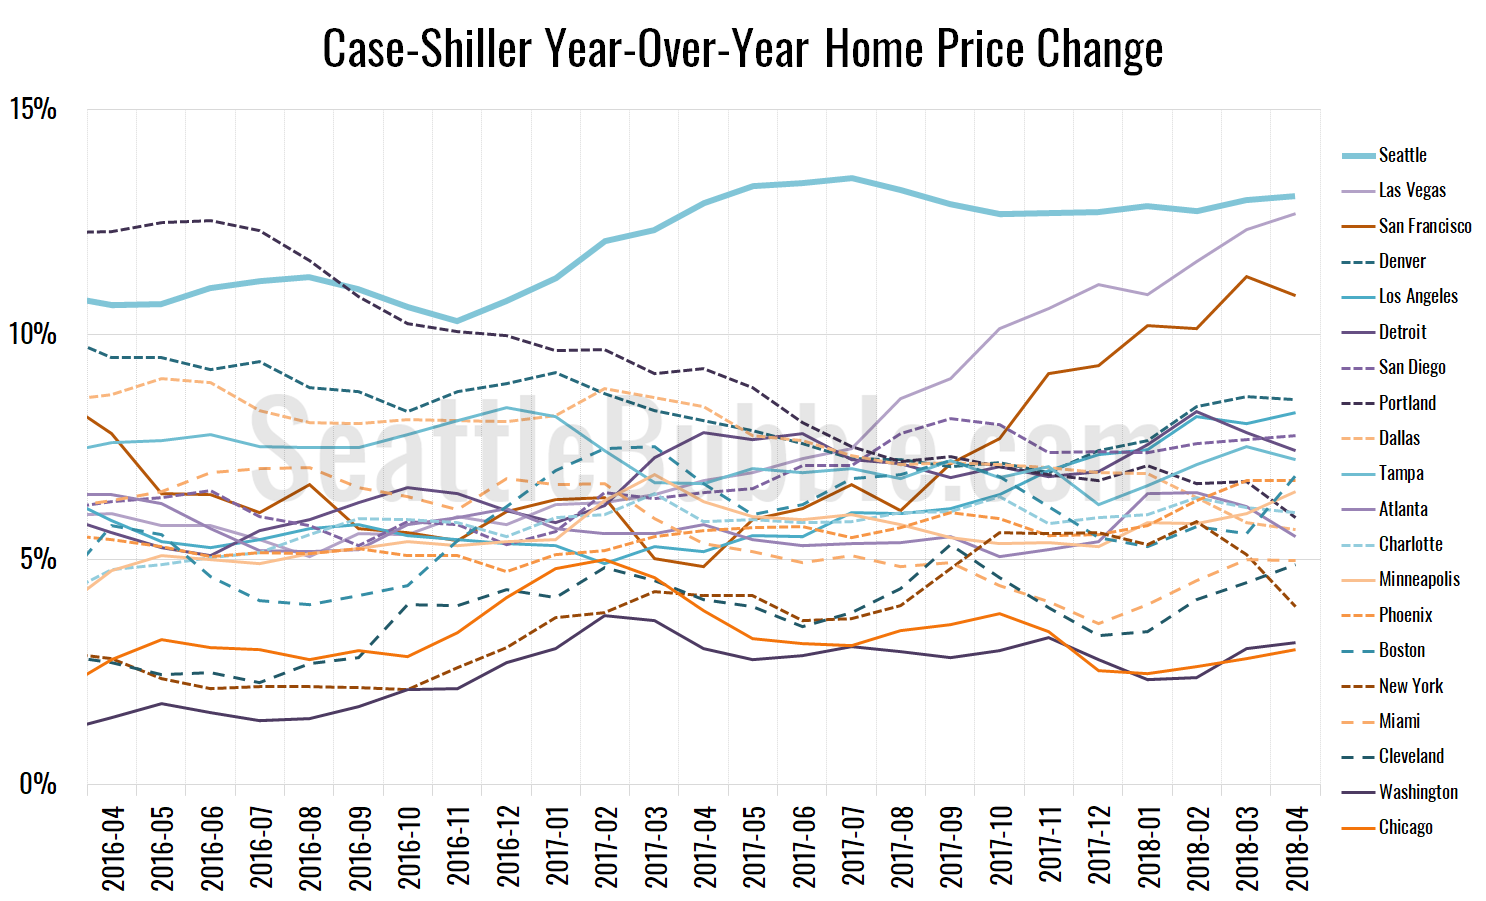
Let’s have a look at the latest data from the Case-Shiller Home Price Index. According to April data that was released last week, Seattle-area home prices were:
Up 2.7 percent March to April
Up 13.1 percent year-over-year.
Up 30.8 percent from the July 2007 peak
Over the same period last year prices were up 2.6 percent month-over-month and year-over-year prices were up 12.9 percent.
Seattle still leads the nation in both year-over-year and month-over-month home price growth. Seattle has had the highest year-over-year price growth since September 2016. The only other metro areas with double-digit price growth from a year earlier in April were Las Vegas at 12.7 percent and San Francisco at 10.9 percent.


