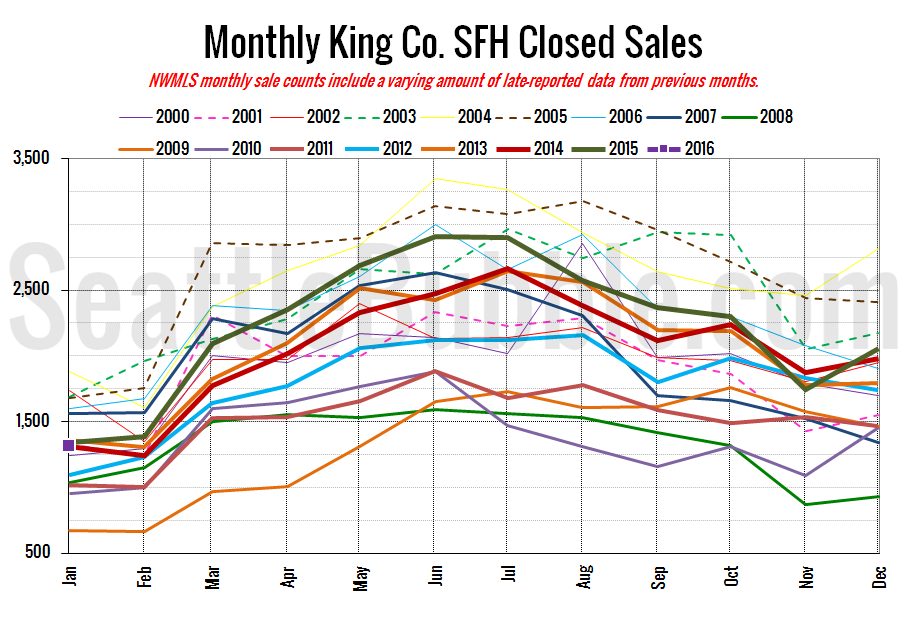
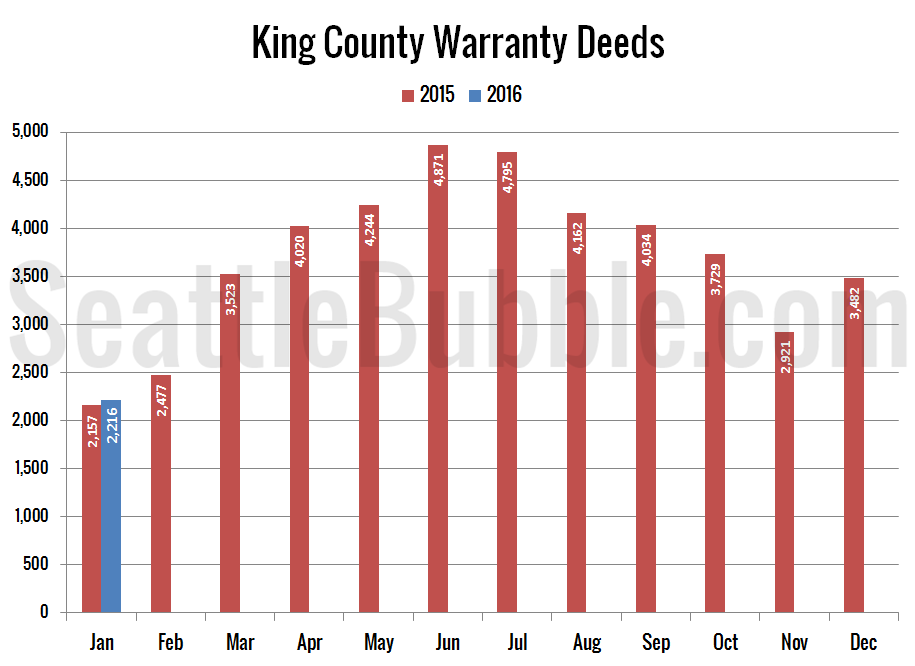
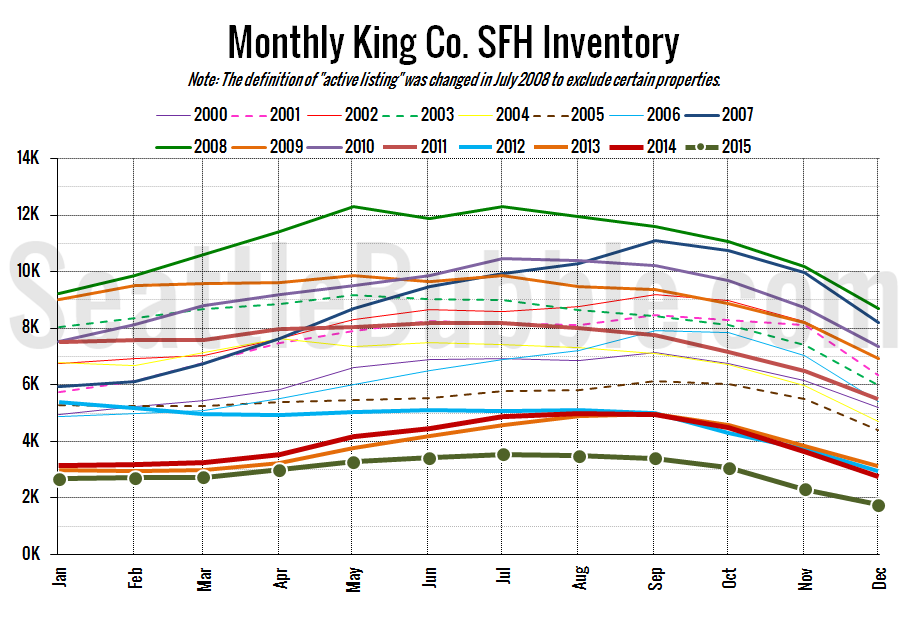
Get access to the full spreadsheets used to make the charts in this and other posts, as well as a variety of additional insider benefits by becoming a member of Seattle Bubble. January market stats were published by the NWMLS yesterday. Before we get into our monthly stats, here’s a quick look at their press…
Category: Counties
County-wide statistics.
January Stats Preview: A Glimmer of Hope for Inventory
The first month of 2016 is now behind us, so let’s have a look at our monthly stats preview. First up, here’s the snapshot of all the data as far back as my historical information goes, with the latest, high, and low values highlighted for each series: A glimmer of hope for buyers in King…
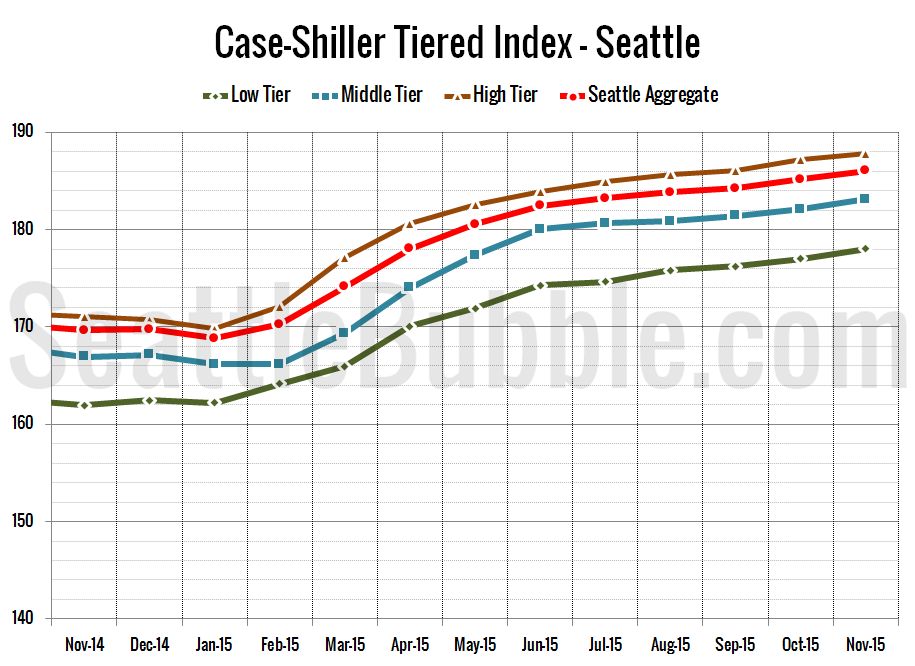
Case-Shiller Tiers: High Tier Home Prices Surpass 2007 Peak
Let’s check out the three price tiers for the Seattle area, as measured by Case-Shiller. Remember, Case-Shiller’s “Seattle” data is based on single-family home repeat sales in King, Pierce, and Snohomish counties. Note that the tiers are determined by sale volume. In other words, 1/3 of all sales fall into each tier. For more details…
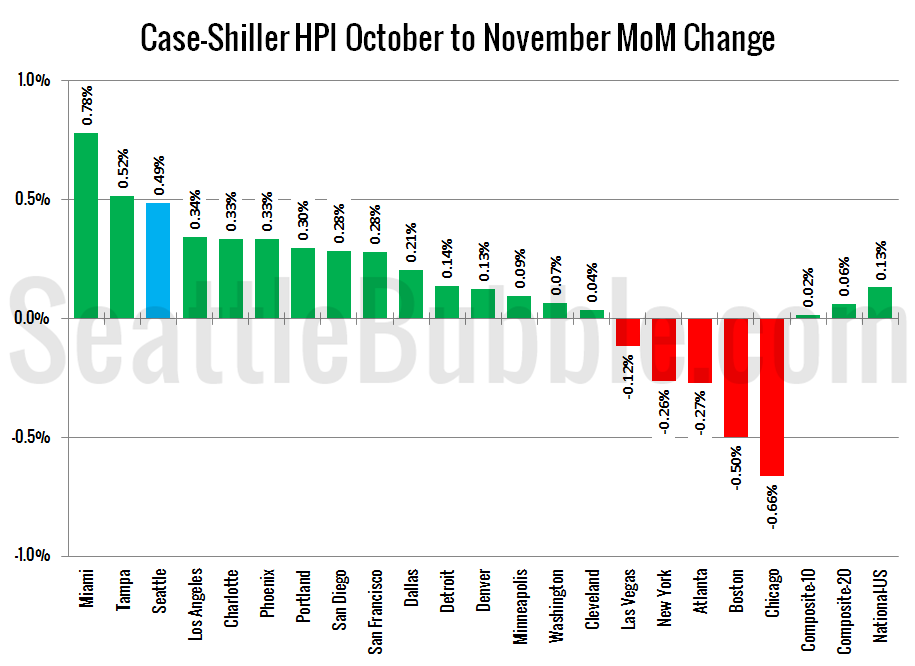
Case-Shiller: Seattle Home Price Gains Power Into Winter
Let’s have a look at the latest data from the Case-Shiller Home Price Index. According to August data that was released today, Seattle-area home prices were: Up 0.5 percent October to November Up 9.7 percent YOY. Down 3.2 percent from the July 2007 peak Over the same period in 2014 prices were down 0.3 percent…
NWMLS: 2015 Was the Worst Year Ever for Home Buyers
After setting a new all-time low inventory level in November, listings dropped off dramatically yet again to set another new all-time low in December. Here’s hoping we see somewhat of a turnaround in inventory for 2016. If not, expect another overheated year.
