Skip to content

Seattle Bubble

local real estate news, statistics, and commentary without the sales spin.

Menu
  • Home
  • About
  • Contact
  • Reference
  • Speaking
Menu

Category: Counties

County-wide statistics.

Actual Home Prices Edging Above the “Affordable” Price

Posted on September 24, 2015September 29, 2015 by The Tim

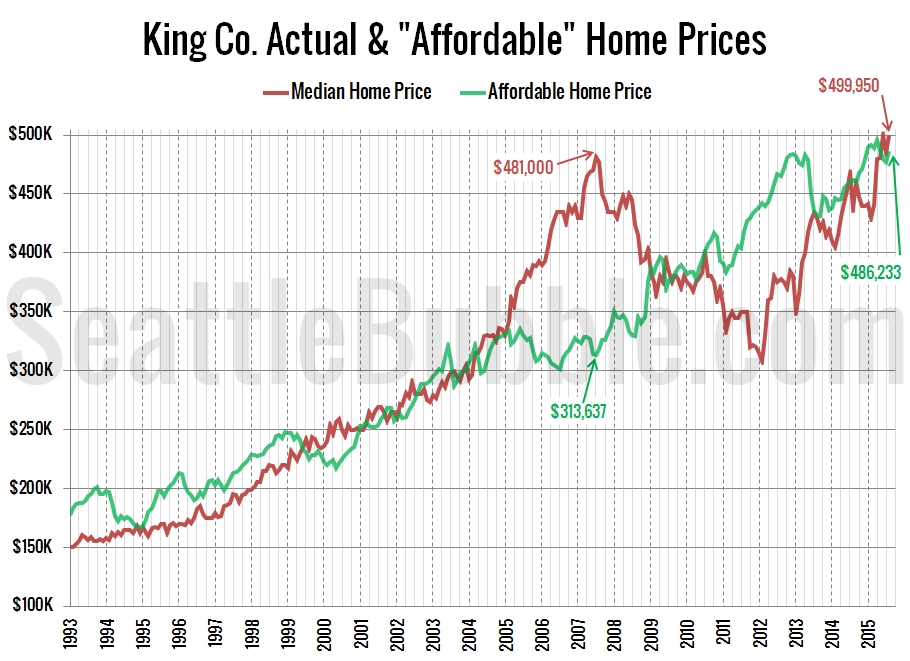
Here’s an updated look at the “affordable home” price chart.

In this graph I flip the variables in the affordability index calculation around to other sides of the equation to calculate what price home the a family earning the median household income could afford to buy at today’s mortgage rates if they put 20% down and spent 30% of their monthly income.

The “affordable” home price hit $496,051 back in April, but has since dropped off…
Share:

  • Twitter
  • LinkedIn
  • Facebook
  • Reddit
  • Pinterest
  • Email

Affordability Will Be Destroyed if Interest Rates Increase

Posted on September 23, 2015September 27, 2022 by The Tim

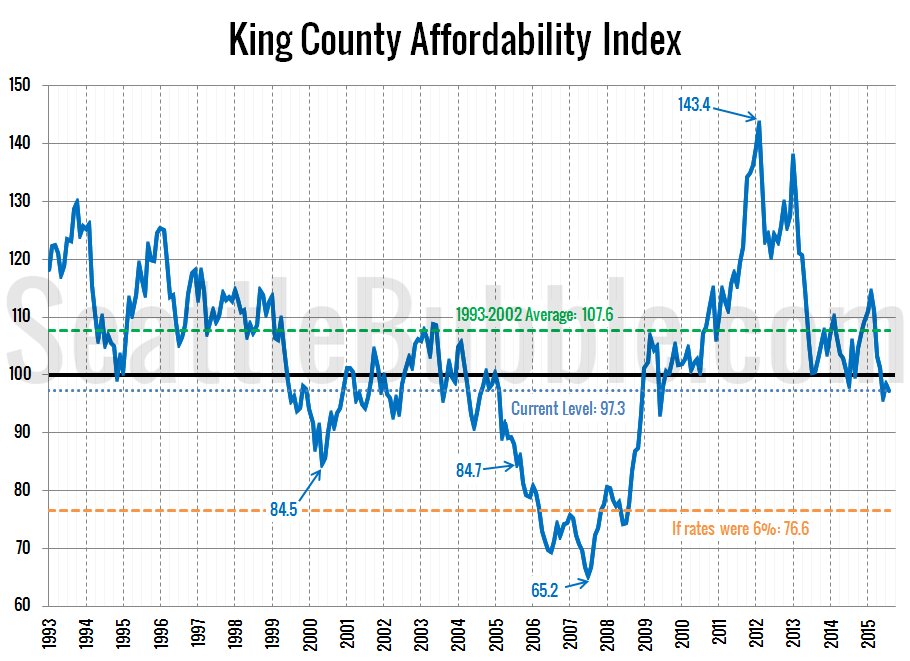
Don’t forget, you can get access to the spreadsheets used to make the charts in this and other posts by becoming a member of Seattle Bubble. It’s been a few months since we took a look at the local affordability index. So, let’s have a new look at all of our affordability index charts. As…

Share:

  • Twitter
  • LinkedIn
  • Facebook
  • Reddit
  • Pinterest
  • Email

Foreclosures Back to Pre-Bust Levels Around Seattle

Posted on September 22, 2015September 23, 2015 by The Tim

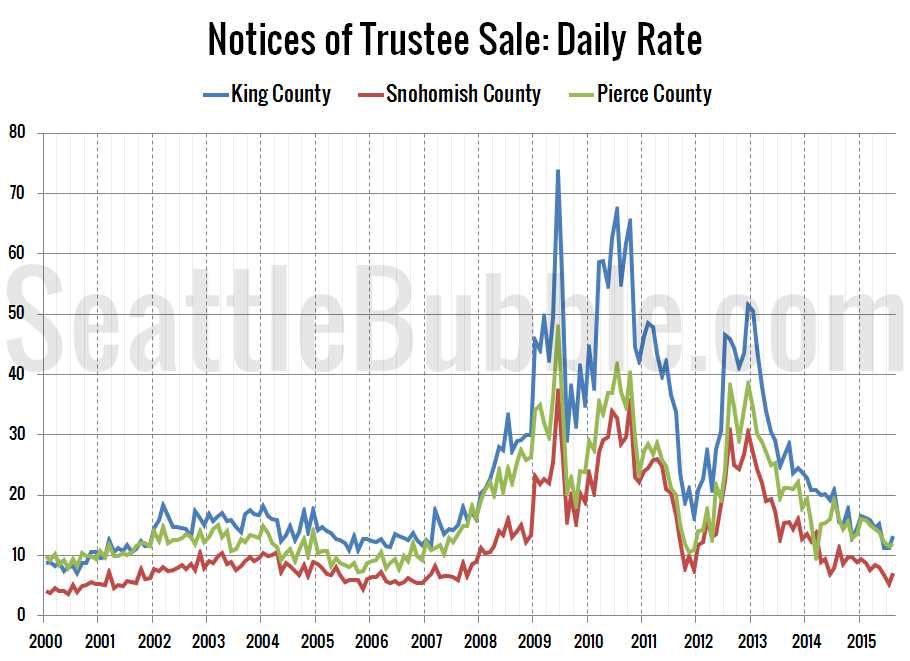
Get access to the full spreadsheets used to make the charts in this and other posts by becoming a member of Seattle Bubble. It’s been a few months since we took a detailed look at foreclosure stats in King, Snohomish, and Pierce counties, so let’s update those numbers. First up, the Notice of Trustee Sale…

Share:

  • Twitter
  • LinkedIn
  • Facebook
  • Reddit
  • Pinterest
  • Email

Around the Sound: No Relief for Buyers Anywhere

Posted on September 10, 2015September 14, 2015 by The Tim

Get access to the full spreadsheets used to make the charts in this and other posts by becoming a member of Seattle Bubble. It’s been a few months since we updated our monthly stats for the local regions outside of the King/Snohomish core. Here’s your August update to our “Around the Sound” statistics for Pierce,…

Share:

  • Twitter
  • LinkedIn
  • Facebook
  • Reddit
  • Pinterest
  • Email

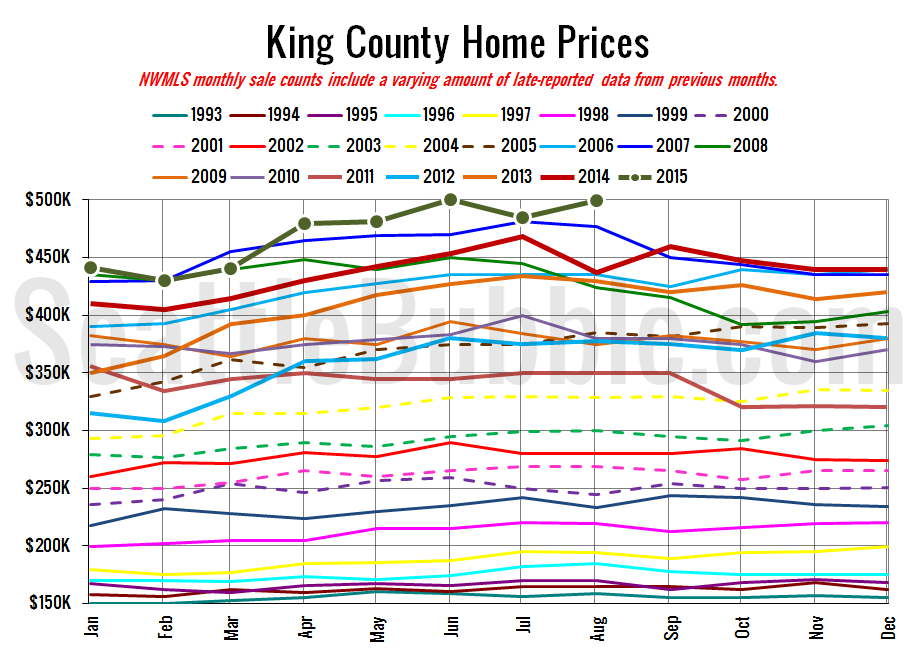
NWMLS: Sales Slow in August as Prices Continue Surging

Posted on September 4, 2015September 8, 2015 by The Tim

Get access to the full spreadsheets used to make the charts in this and other posts, as well as a variety of additional insider benefits by becoming a member of Seattle Bubble.

August market stats were published by the NWMLS yesterday. Before we get into our monthly stats, here’s a quick look at their press release.

Opinions vary on possibility of a housing slowdown, but numbers show solid activity
[…]

Share:

  • Twitter
  • LinkedIn
  • Facebook
  • Reddit
  • Pinterest
  • Email

Posts navigation

  • Previous
  • 1
  • …
  • 31
  • 32
  • 33
  • 34
  • 35
  • 36
  • 37
  • …
  • 145
  • Next

Tim’s Other Projects

Dispatches from the Multiverse

Tip Jar

Like what we're doing?

Drop us a tip!

Accounts

  • Log in
  • Entries feed
  • Comments feed
  • WordPress.org
©2024 Seattle Bubble | Built using WordPress and Responsive Blogily theme by Superb