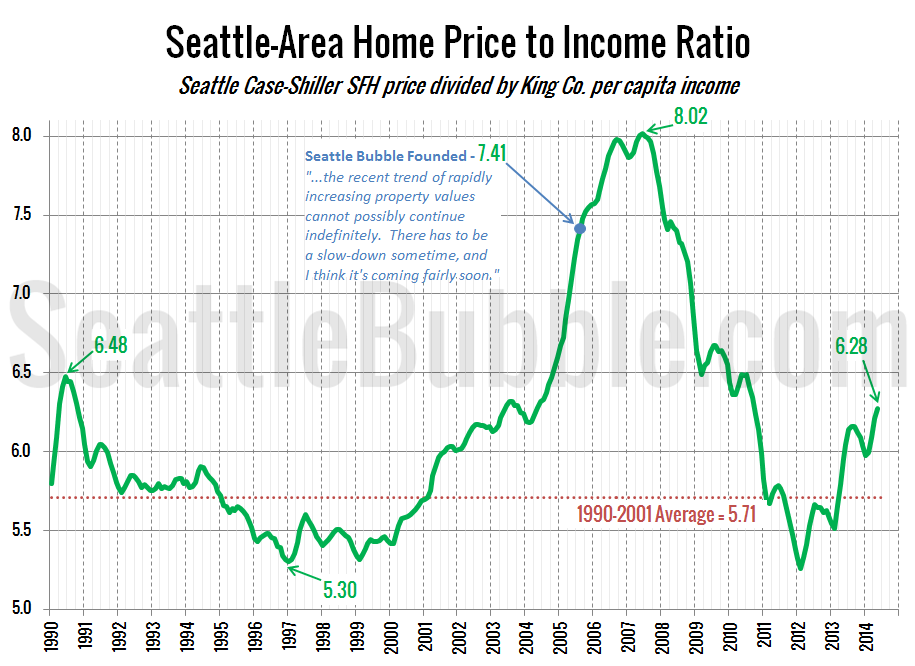
Continuing the “Another Bubble?” series we began yesterday, let’s take a look at another housing bubble metric: home prices compared to incomes. For this post I’ll be using the Case-Shiller Home Price Index for the Seattle area (which rolls together King, Snohomish, and Pierce counties) and Bureau of Economic Analysis data on per capita incomes…
Category: Counties
County-wide statistics.
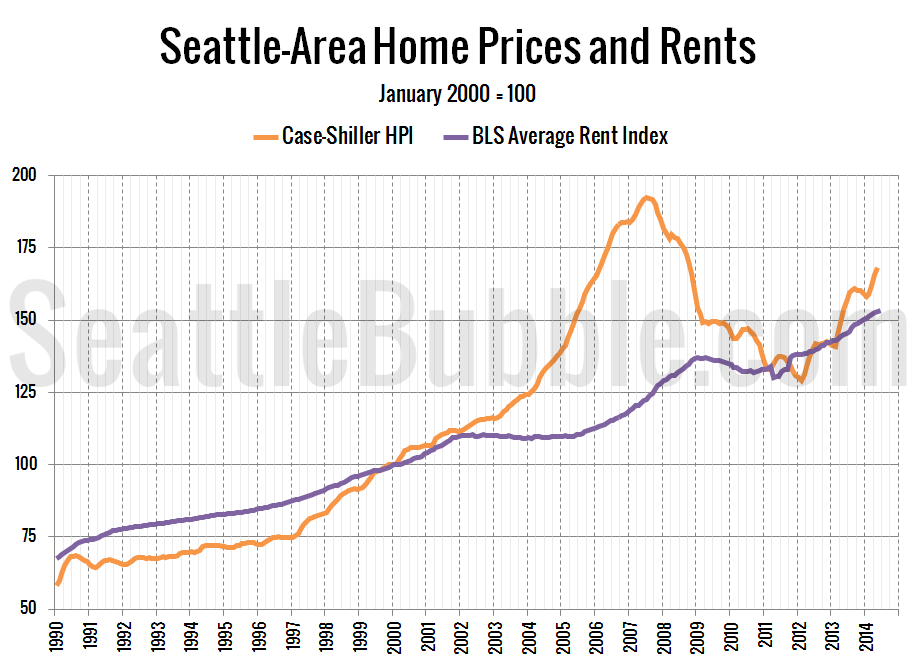
Another Real Estate Bubble? Price to Rent Ratio Shoots Up
With home prices approaching or even exceeding their 2007 peak levels in parts of the Seattle area, there has been renewed talk about whether we’re in another housing bubble or not. This week I’d like to go back to the same data I used in 2005 and 2006 to definitively recognize the bubble at a…
Around the Sound: Listing Supply Still Tight
It’s time for us to check up on stats outside of the King/Snohomish core with our “Around the Sound” statistics for Pierce, Kitsap, Thurston, Island, Skagit, and Whatcom counties. If there is certain data you would like to see or ways you would like to see the data presented differently, drop a comment below and…
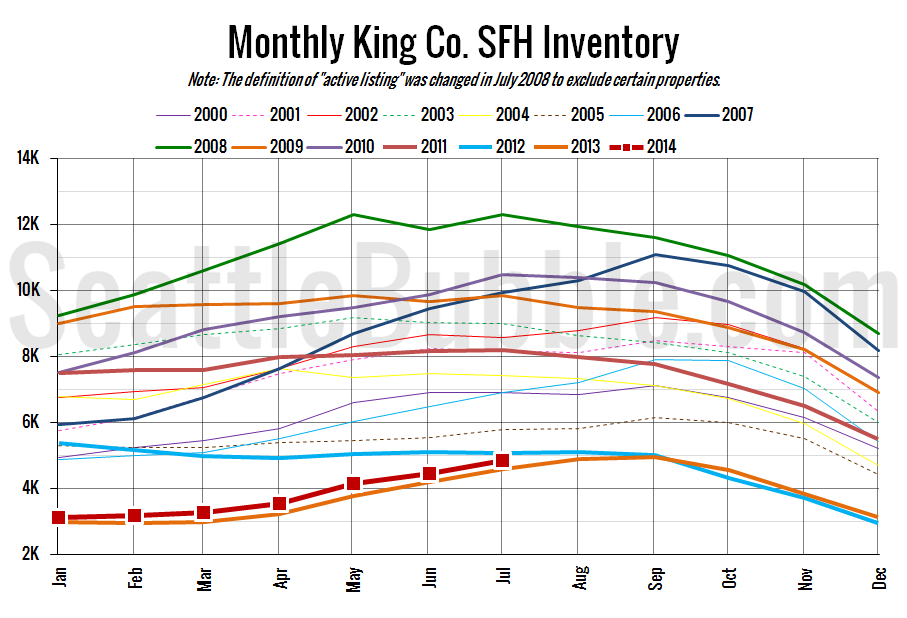
NWMLS: Inventory Inches Up as Home Prices Near Peak
July market stats were published by the NWMLS today. Here’s a snippet from their press release: Western Washington housing market in “recovery mode” but some brokers say it’s still not at full potential. More sellers listed their homes for sale during July compared to a year ago, but brokers with Northwest Multiple Listing Service say…
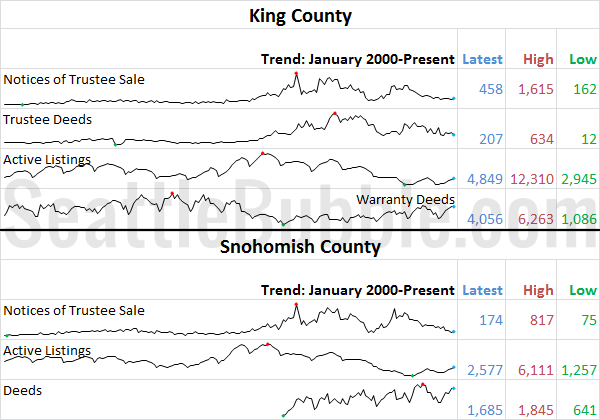
July Stats Preview: Sales Softness Resumes
With July 2014 now in the history books, let’s have a look at our monthly stats preview. Most of the charts below are based on broad county-wide data that is available through a simple search of King County and Snohomish County public records. If you have additional stats you’d like to see in the preview,…


