Skip to content

Seattle Bubble

local real estate news, statistics, and commentary without the sales spin.

Menu
  • Home
  • About
  • Contact
  • Reference
  • Speaking
Menu

Category: Counties

County-wide statistics.

Real Estate Heat Index plummets in 2018—now at lowest level in over six years

Posted on October 10, 2018October 10, 2018 by The Tim

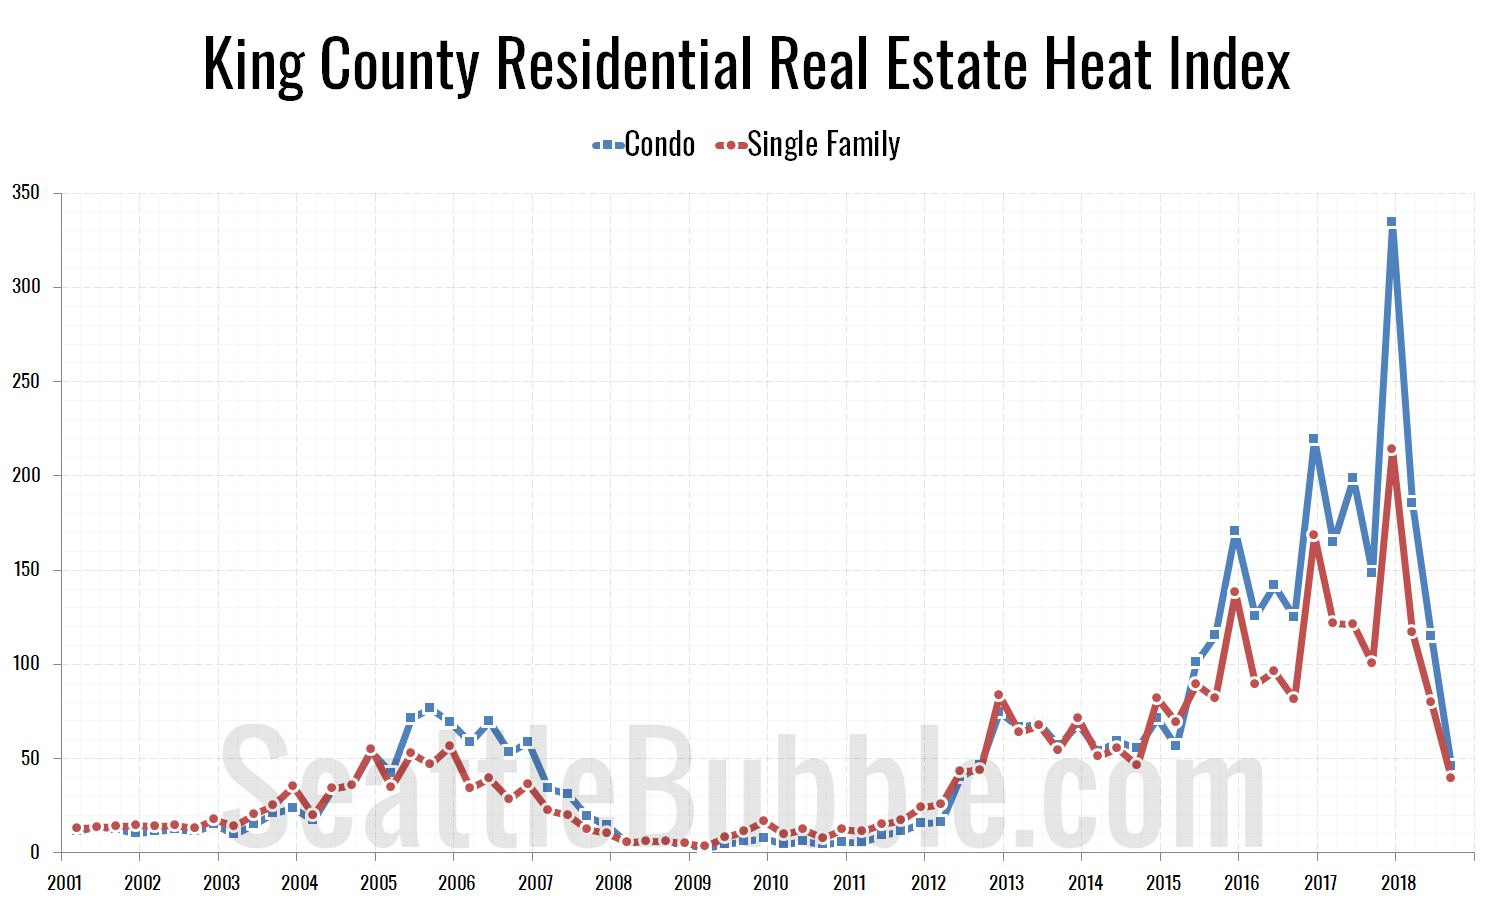
Like the charts and data that I’m posting? Want to support the ongoing work of this site? Good news, everyone! You can becoming a member of Seattle Bubble and get access to the data as well as other perks! We haven’t taken a look at my “Residential Real Estate Heat Index” for King County single-family…

Share:

  • Twitter
  • LinkedIn
  • Facebook
  • Reddit
  • Pinterest
  • Email

Around the Sound: Inventory growth, sales declines spread outside of King County

Posted on October 8, 2018October 8, 2018 by The Tim

With September’s stats in hand, let’s look at broader Puget Sound area. Here’s the latest update to our “Around the Sound” statistics for King, Snohomish, Pierce, Kitsap, Thurston, Island, Skagit, and Whatcom counties.
…
The biggest gains in new listings and active inventory are still in King County. Snohomish, Pierce, Kitsap and Thurston all also saw some decent gains in inventory, but in Island, Skagit, and Whatcom inventory was flat or still down. Meanwhile, closed sales are falling everywhere but Whatcom.

Share:

  • Twitter
  • LinkedIn
  • Facebook
  • Reddit
  • Pinterest
  • Email
Home Price Changes: May to September - Median Sale Price of King County Single-Family Homes

Home prices fell more between May and September this year than any previous year

Posted on October 5, 2018October 5, 2018 by The Tim

Between May and September this year, the median sale price of single-family homes in King County has fallen 8.0 percent. Most years home prices rise between May and September. The biggest decline between those months in previous years was 5.7 percent in 2008…

Share:

  • Twitter
  • LinkedIn
  • Facebook
  • Reddit
  • Pinterest
  • Email

NWMLS: Inventory continues to climb as sales slow

Posted on October 4, 2018 by The Tim

September market stats were published by the NWMLS today. Home prices have leveled off as sales continue to slip and inventory piles up. Year-over-year listing growth hit its highest level ever as the number of homes on the market reached its highest level since January 2012…

Share:

  • Twitter
  • LinkedIn
  • Facebook
  • Reddit
  • Pinterest
  • Email

September Stats Preview: Sales drop over 25 percent from 2017 as listings continue to pile up

Posted on October 1, 2018October 1, 2018 by The Tim

Home sales volume was at its lowest September level in six years for both King and Snohomish County last month, dipping over 22 percent from a year ago. As a result, the number of homes on the market hit its highest point since early 2012. Foreclosures are still at all-time lows…

Share:

  • Twitter
  • LinkedIn
  • Facebook
  • Reddit
  • Pinterest
  • Email

Posts navigation

  • Previous
  • 1
  • …
  • 5
  • 6
  • 7
  • 8
  • 9
  • 10
  • 11
  • …
  • 145
  • Next

Tim’s Other Projects

Dispatches from the Multiverse

Tip Jar

Like what we're doing?

Drop us a tip!

Accounts

  • Log in
  • Entries feed
  • Comments feed
  • WordPress.org
©2024 Seattle Bubble | Built using WordPress and Responsive Blogily theme by Superb