Skip to content

Seattle Bubble

local real estate news, statistics, and commentary without the sales spin.

Menu
  • Home
  • About
  • Contact
  • Reference
  • Speaking
Menu

Category: Counties

County-wide statistics.

Case-Shiller Tiers: Low tier home prices edged up in July as mid and high tiers slipped

Posted on September 26, 2018October 1, 2018 by The Tim

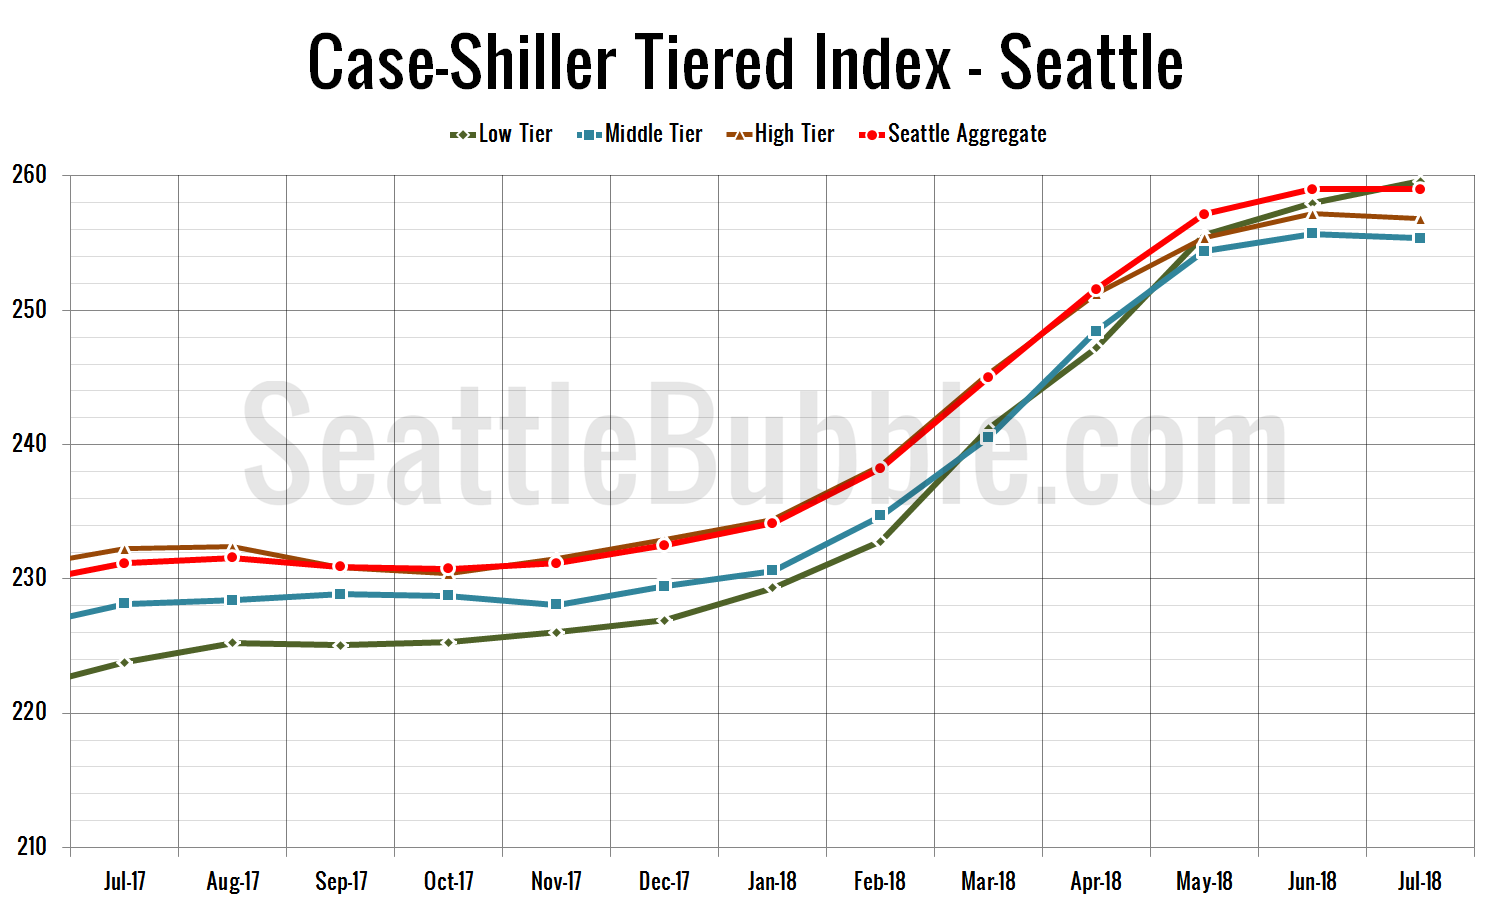
Let’s check out the three price tiers for the Seattle area, as measured by Case-Shiller. Remember, Case-Shiller’s “Seattle” data is based on single-family home repeat sales in King, Pierce, and Snohomish counties.

Only the low tier was up month-over-month once more in July. The middle tier and high tier both fell…

Share:

  • Twitter
  • LinkedIn
  • Facebook
  • Reddit
  • Pinterest
  • Email

Case-Shiller: Seattle was the only market to see price declines between June and July

Posted on September 25, 2018October 1, 2018 by The Tim

Let’s have a look at the latest data from the Case-Shiller Home Price Index. According to July data that was released today, Seattle-area home prices were:

Down less than 0.1 percent June to July
Up 12.1 percent YOY.
Up 34.7 percent from the July 2007 peak

Last year at this time prices were up 0.7 percent month-over-month and year-over-year prices were up 13.5 percent…

Share:

  • Twitter
  • LinkedIn
  • Facebook
  • Reddit
  • Pinterest
  • Email

The difference between affordable and actual home prices hit an all-time record in May

Posted on September 21, 2018October 1, 2018 by The Tim

As promised yesterday, here’s an updated look at the “affordable home” price chart.
…
The “affordable” home price has bounced around between about $550,000 and $590,000 since the beginning of 2017. The current “affordable” home price of $568,758 in King County would have a monthly payment of $2,319…

Share:

  • Twitter
  • LinkedIn
  • Facebook
  • Reddit
  • Pinterest
  • Email

Low affordability may be why sales are stalling out

Posted on September 20, 2018October 1, 2018 by The Tim

By popular request, let’s take a look at our affordability index charts for the counties around Puget Sound.

As of August, the affordability index has bounced up slightly from its May low (which was the lowest point since nearly a decade ago in July 2008), but still sits at the very low level of 85.0.

For context, eighty-six percent of the 306 months on record back through 1993 have had a higher affordability index than what we had in August 2018…

Share:

  • Twitter
  • LinkedIn
  • Facebook
  • Reddit
  • Pinterest
  • Email

New listing absorption softens more as pending sales slip

Posted on September 18, 2018October 1, 2018 by The Tim

I’ve got a few charts to update you with, but let’s start with a few charts that sum up the state of King County single-family listings, inventory, and pending sales.

After five or six years of the same story month after month—fewer listings, more sales, soaring prices—the market has definitely turned in 2018. Pending sales are now on the decline and inventory is rising rapidly. Let’s see what this looks like in charts…

Share:

  • Twitter
  • LinkedIn
  • Facebook
  • Reddit
  • Pinterest
  • Email

Posts navigation

  • Previous
  • 1
  • …
  • 6
  • 7
  • 8
  • 9
  • 10
  • 11
  • 12
  • …
  • 145
  • Next

Tim’s Other Projects

Dispatches from the Multiverse

Tip Jar

Like what we're doing?

Drop us a tip!

Accounts

  • Log in
  • Entries feed
  • Comments feed
  • WordPress.org
©2024 Seattle Bubble | Built using WordPress and Responsive Blogily theme by Superb