Skip to content

Seattle Bubble

local real estate news, statistics, and commentary without the sales spin.

Menu
  • Home
  • About
  • Contact
  • Reference
  • Speaking
Menu

Category: Statistics

Statistics, number-based analysis, etc.

NWMLS: Prices surge as sales slip and inventory inches up

Posted on April 6, 2018 by The Tim

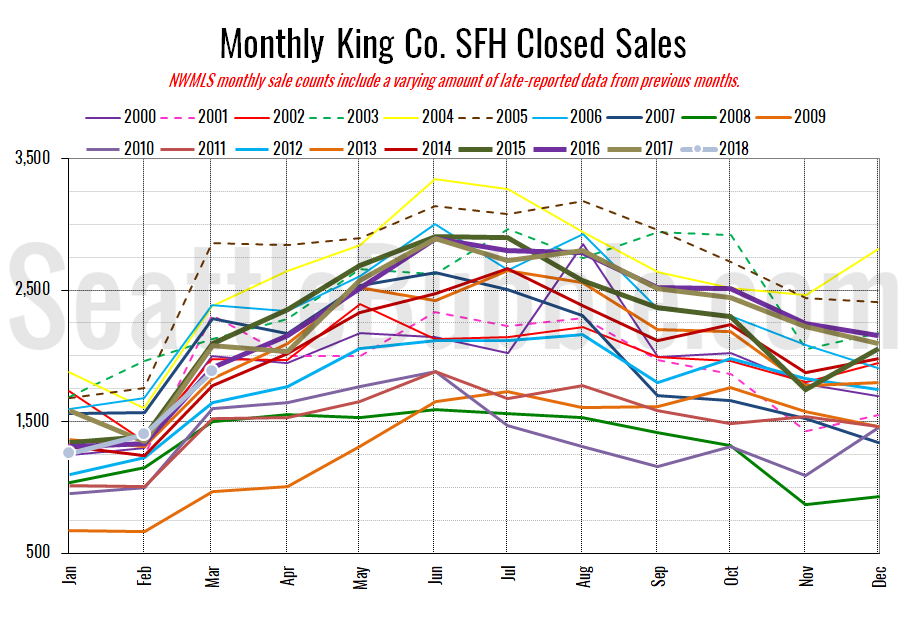
March market stats have been published by the NWMLS…

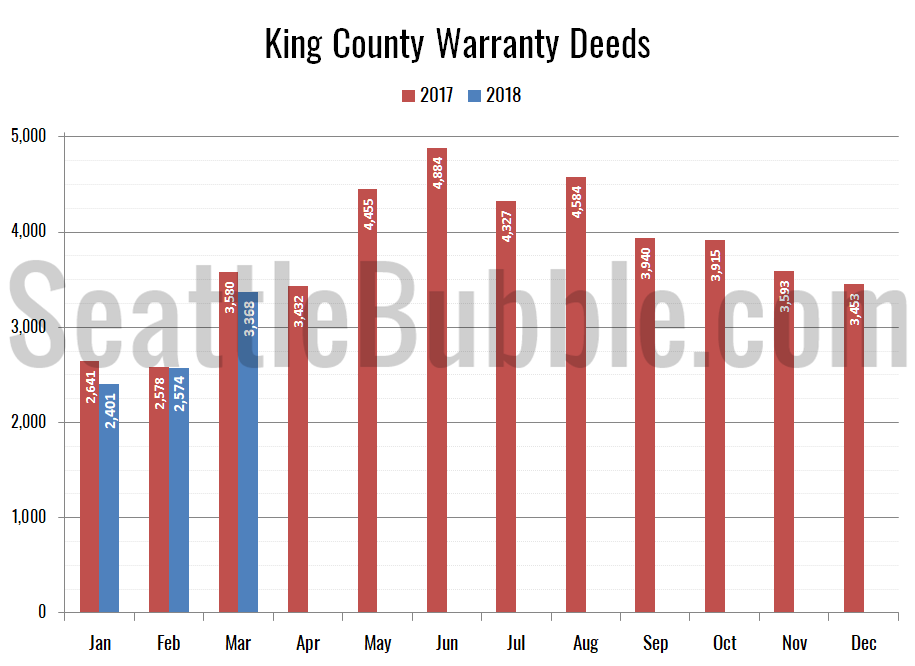
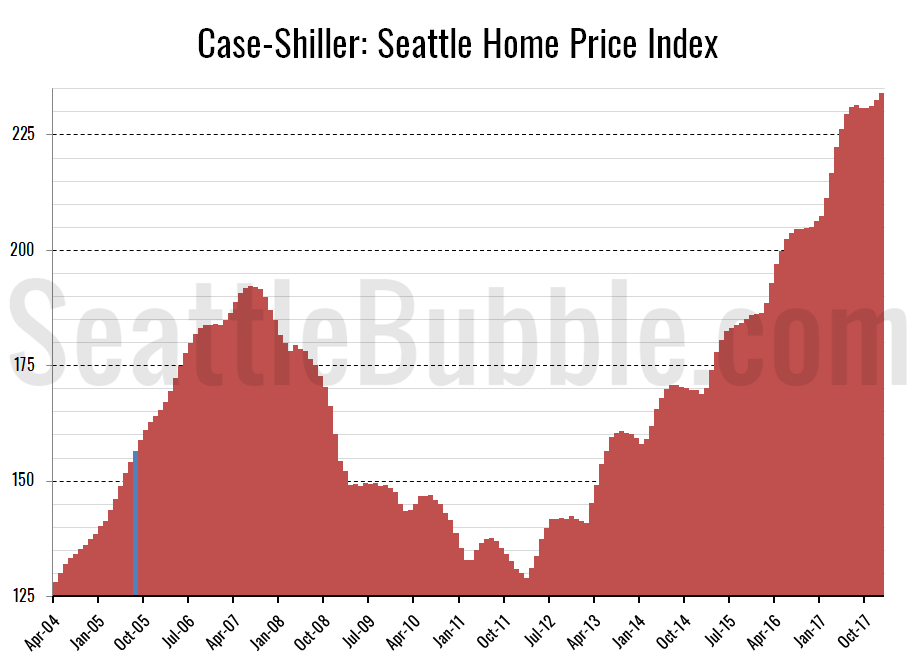
Despite the big bump up in prices to a new all-time high, there is some good-ish news for home buyers in the March data. Compared to a year ago, new listings are up, total listings were basically flat, and sales were down. The overall market is still definitely heavily skewed toward sellers, but at least last month’s trends are finally moving a little bit in buyers’ favor.

Share:

  • Twitter
  • LinkedIn
  • Facebook
  • Reddit
  • Pinterest
  • Email

Consumer Confidence at levels not seen since the dot-com bust

Posted on April 3, 2018September 26, 2018 by The Tim

It’s been quite a while since we last checked in on Consumer Confidence and mortgage interest rates, so let’s take a look at an update to those charts.

The overall Consumer Confidence Index currently sits at 127.7, down two percent in a month and up two percent from a year ago. The current levels are higher than any point since late 2000, just as the dot-com bubble was bursting…

Share:

  • Twitter
  • LinkedIn
  • Facebook
  • Reddit
  • Pinterest
  • Email

March Stats Preview: Sales slip slightly from last March

Posted on April 2, 2018 by The Tim

Now that March is done, let’s look at our regular monthly “preview” charts. Here’s the summary for March: Sales look to be a bit lower than last year, even as the spring bump has begun. Listings are still struggling to make gains. Foreclosures are still nearly non-existent.

Here’s the snapshot of all the data as far back as my historical information goes, with the latest, high, and low values highlighted for each series:

King & Snohomish County Stats Preview

If sales start falling off, we could see some hope for buyers later in 2018, but right now it’s too early to make a call like that…

Share:

  • Twitter
  • LinkedIn
  • Facebook
  • Reddit
  • Pinterest
  • Email

Case-Shiller Tiers: To. The. Moon.

Posted on March 28, 2018March 28, 2018 by The Tim

Let’s check out the three price tiers for the Seattle area, as measured by Case-Shiller. Remember, Case-Shiller’s “Seattle” data is based on single-family home repeat sales in King, Pierce, and Snohomish counties.

Note that the tiers are determined by sale volume. In other words, 1/3 of all sales fall into each tier. For more details on the tier methodologies, hit the full methodology pdf. Here are the current tier breakpoints:

  • Low Tier: < $373,070 (up 0.2%)
  • Mid Tier: $373,070 – $604,377
  • Hi Tier: > $604,377 (up 0.3%)

Share:

  • Twitter
  • LinkedIn
  • Facebook
  • Reddit
  • Pinterest
  • Email

Case-Shiller: Seattle kicks off 2018 with surging home prices

Posted on March 27, 2018March 28, 2018 by The Tim

Let’s have a look at the latest data from the Case-Shiller Home Price Index. According to January data that was released this week, Seattle-area home prices were:

Up 0.7 percent December to January
Up 12.9 percent year-over-year.
Up 21.8 percent from the July 2007 peak

Over the same period last year prices were up 0.6 percent month-over-month and year-over-year prices were up 11.3 percent.

Seattle still leads the nation in year-over-year price growth. The only other metro areas with double-digit price growth from a year earlier are Las Vegas at 11.1 percent and San Francisco at 10.3 percent.

Share:

  • Twitter
  • LinkedIn
  • Facebook
  • Reddit
  • Pinterest
  • Email

Posts navigation

  • Previous
  • 1
  • …
  • 10
  • 11
  • 12
  • 13
  • 14
  • 15
  • 16
  • …
  • 222
  • Next

Tim’s Other Projects

Dispatches from the Multiverse

Tip Jar

Like what we're doing?

Drop us a tip!

Accounts

  • Log in
  • Entries feed
  • Comments feed
  • WordPress.org
©2024 Seattle Bubble | Built using WordPress and Responsive Blogily theme by Superb