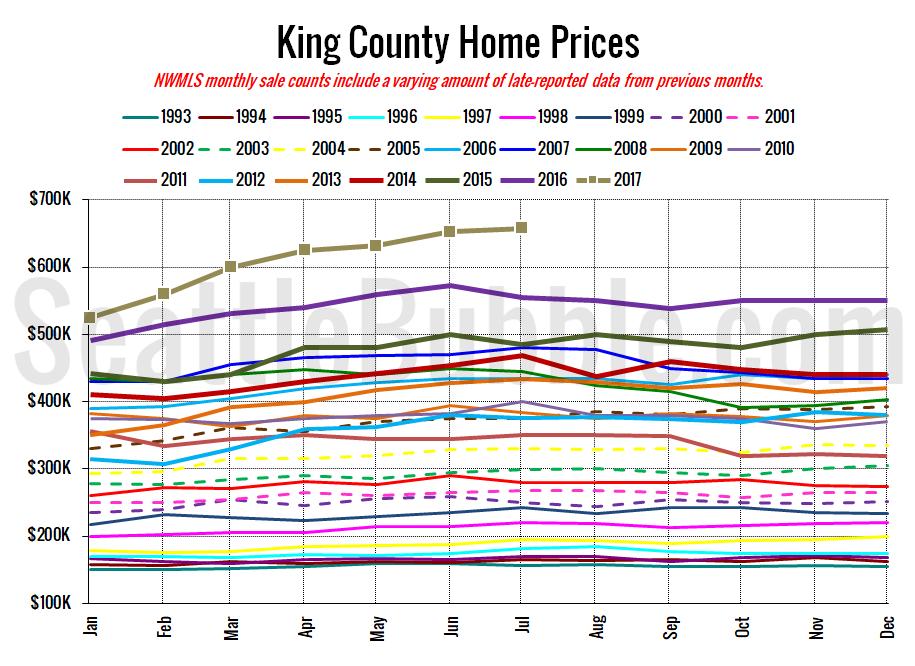
Every month I hope to see some good news for buyers in the numbers. Every month I am disappointed. Listings are still in short supply, sales are strong, and prices just keep going up at a breakneck pace. Sorry, buyers…
local real estate news, statistics, and commentary without the sales spin.
Statistics, number-based analysis, etc.
Every month I hope to see some good news for buyers in the numbers. Every month I am disappointed. Listings are still in short supply, sales are strong, and prices just keep going up at a breakneck pace. Sorry, buyers…
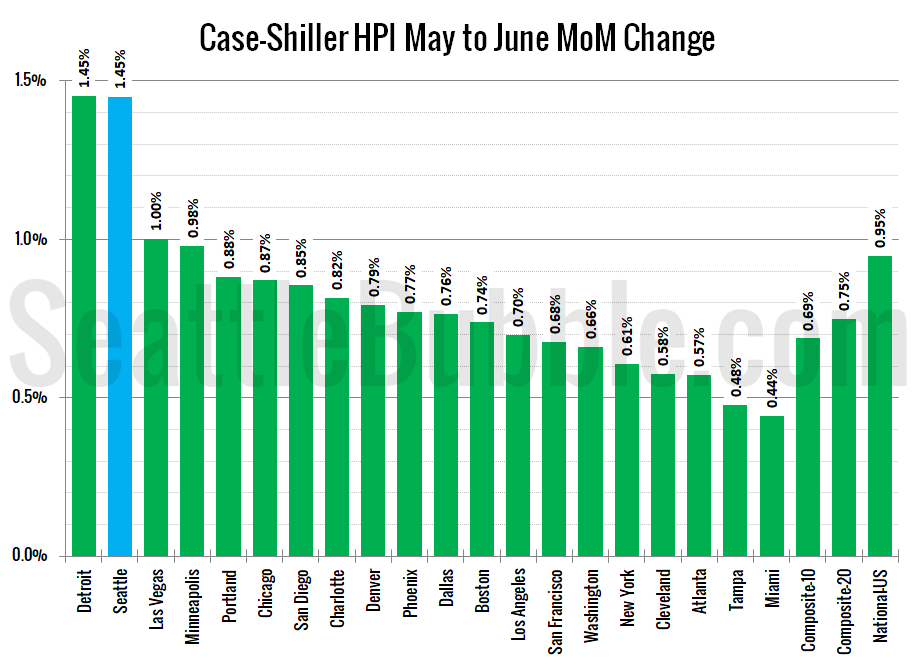
Let’s have a look at the latest data from the Case-Shiller Home Price Index. According to June data that was released this morning, Seattle-area home prices were:
Up 1.4 percent May to June
Up 13.4 percent year-over-year.
Up 19.4 percent from the July 2007 peak
Over the same period last year prices were up 1.4 percent month-over-month and year-over-year prices were up 11.0 percent.
Home price growth in Seattle as measured by Case-Shiller show no signs of slowing. Seattle leads the nation yet again in year-over-year home price growth. However, there was one city that passed Seattle in month-over-month price gains in June—Detroit, of all places.
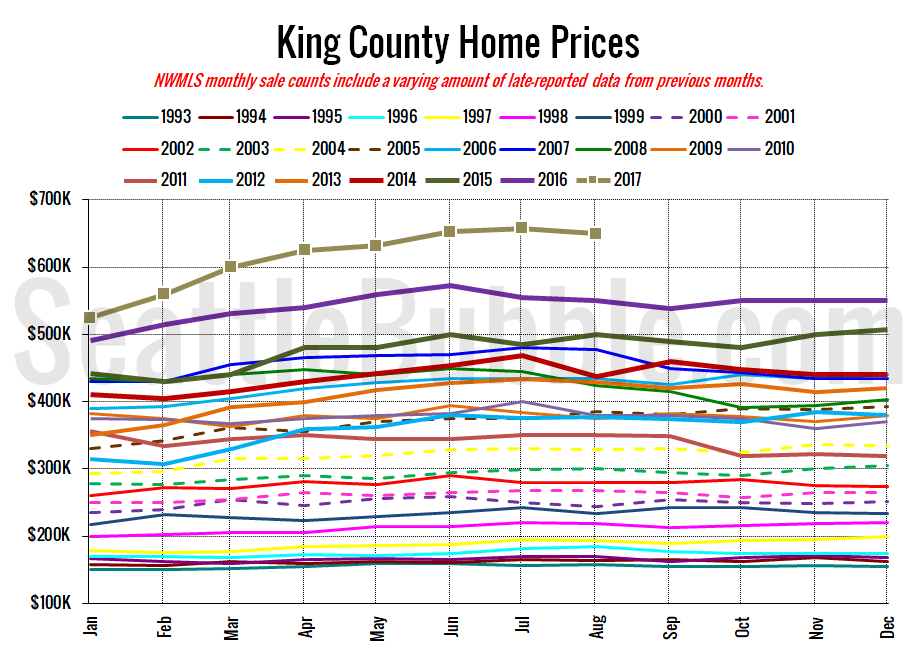
July market stats have been published by the NWMLS. Let’s dive into the numbers for July.
Prices keep climbing as listings are still scarce. What more is there to say? So far this year we haven’t seen any movement in the trends that point to some kind of change coming soon in the market.
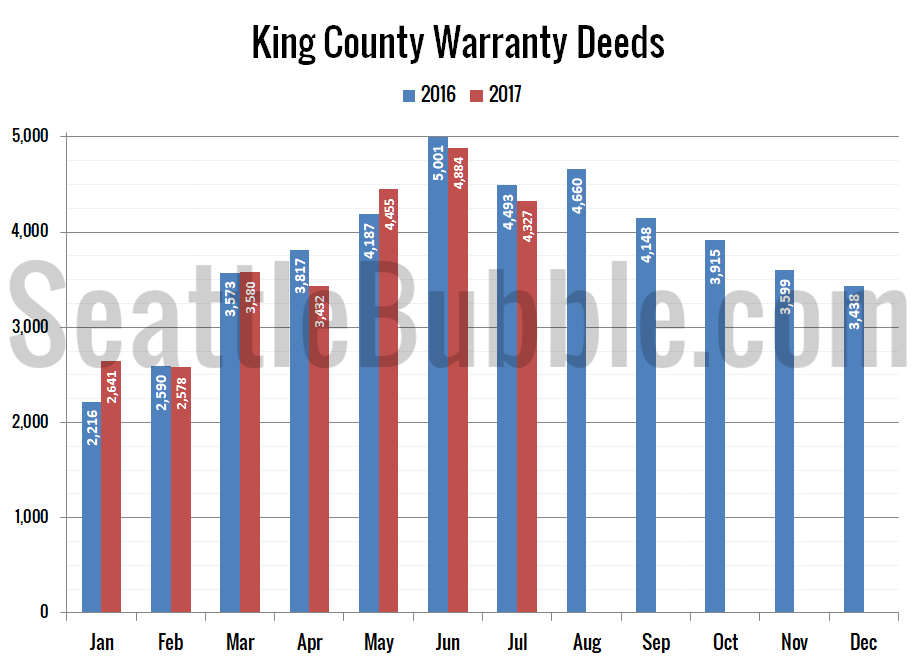
Let’s take a look at regular monthly “preview” charts. Now that July is in the past let’s take a look at the local housing market stats for the month. Short story: Inventory edged up again but is still at historic lows. Sales are slipping slightly year-over-year but are still quite strong. Here’s the snapshot of…
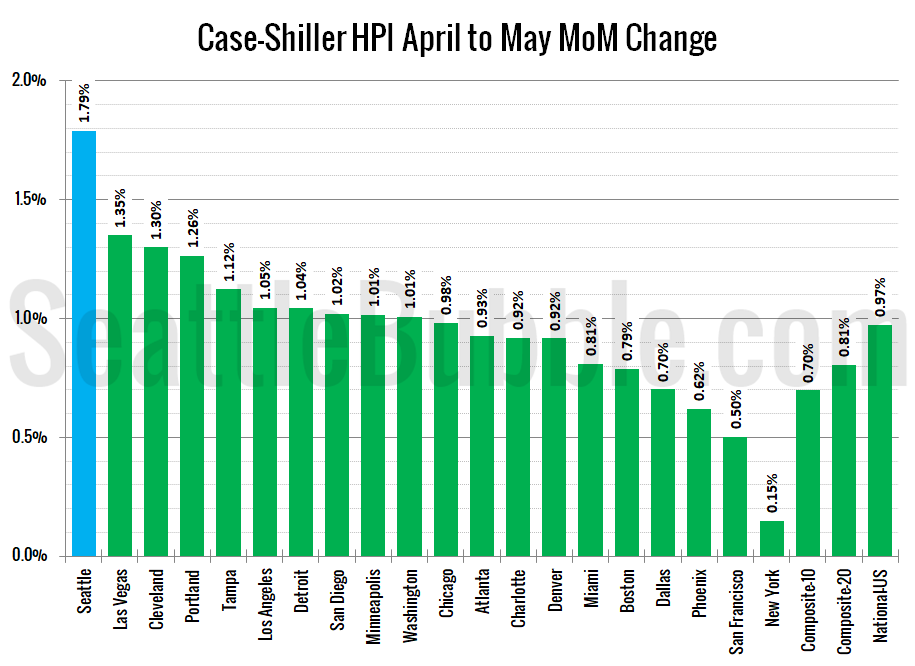
Let’s have a look at the latest data from the Case-Shiller Home Price Index. According to March data that was released this morning, Seattle-area home prices were:
Up 1.8 percent April to May
Up 13.3 percent year-over-year.
Up 17.7 percent from the July 2007 peak
Over the same period last year prices were up 1.4 percent month-over-month and year-over-year prices were up 10.7 percent.
Home price growth in Seattle as measured by Case-Shiller show no signs of slowing. Seattle leads the nation yet again in month-over-month and year-over-year home price growth. Thanks, Amazon.