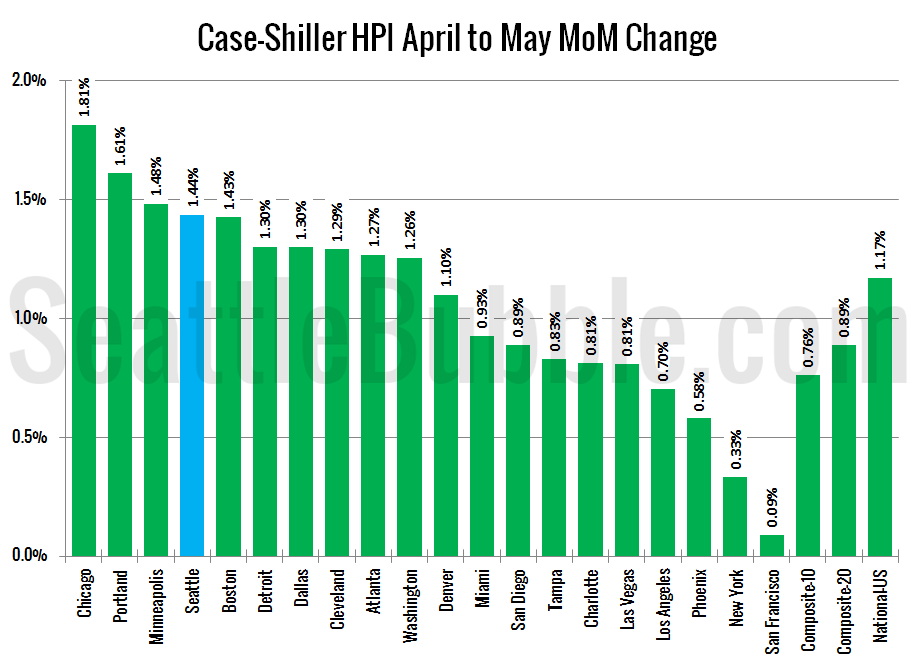
Let’s have a look at the latest data from the Case-Shiller Home Price Index. According to May data that was released this morning, Seattle-area home prices were: Up 1.4 percent April to May Up 10.7 percent YOY. Up 3.9 percent from the July 2007 peak Over the same period last year prices were up 1.4…
Category: Statistics
Statistics, number-based analysis, etc.
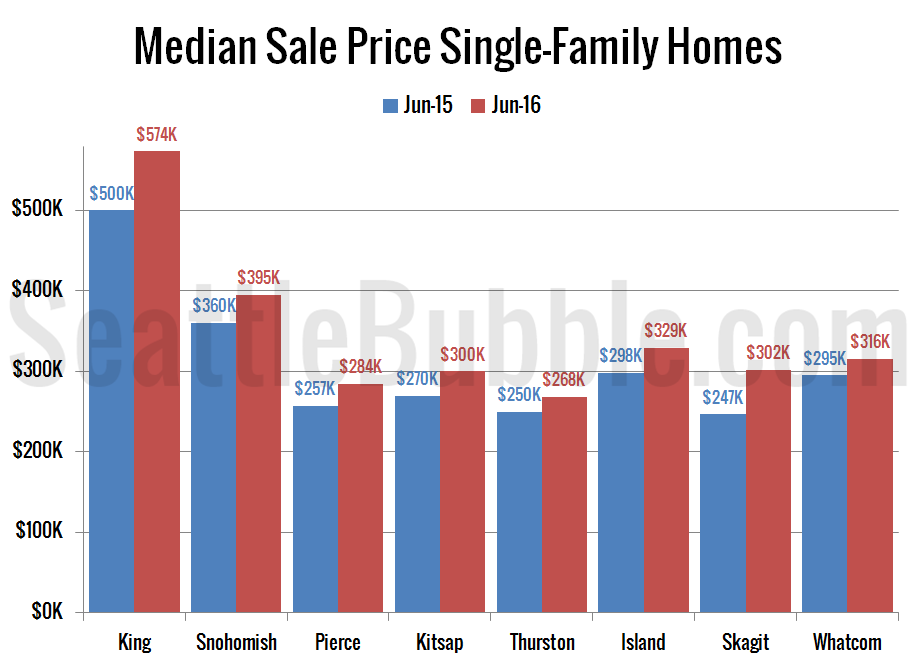
Around The Sound: King County Slightly Less Bleak For Buyers Than Surrounding Region
Get access to the full spreadsheets used to make the charts in this and other posts, and support the ongoing work on this site by becoming a member of Seattle Bubble. Let’s have a look at our housing stats for the broader Puget Sound area. Here’s your June update to our “Around the Sound” statistics…
NWMLS: Listings Inching Up As Sales Flatten
June market stats were published by the NWMLS this morning. The NWMLS press release hasn’t been posted yet, so we’ll cover that tomorrow. On with the stats!
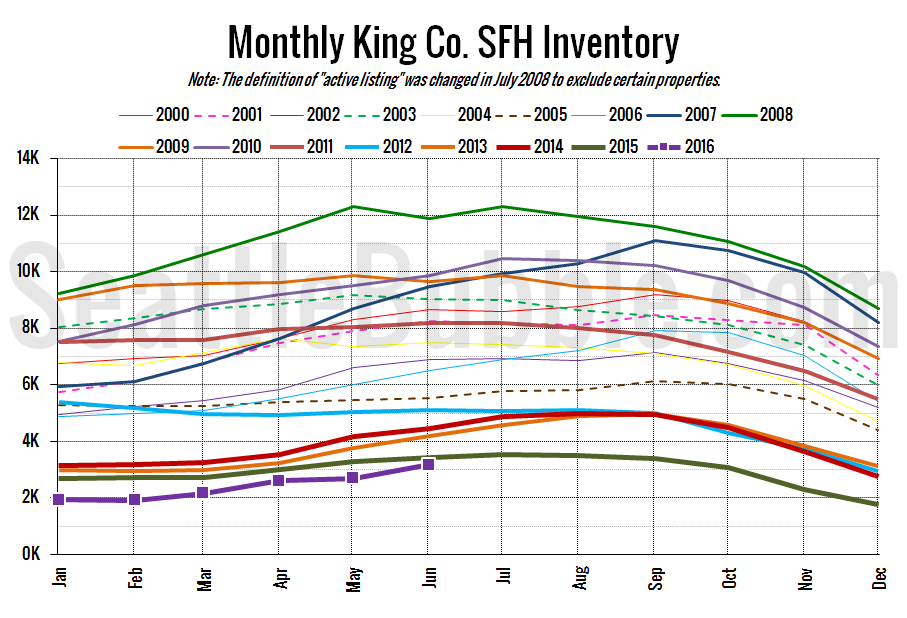
It’s still a bit early to say that we’re turning a corner, but while the overall level of inventory is still at all-time lows for this time of year, the rate of year-over-year change has been getting slightly better every month since December…
June Stats: Inventory Edges Up Despite Record Sales
Now that June is behind us, let’s have our first look at how the month’s real estate stats stack up.
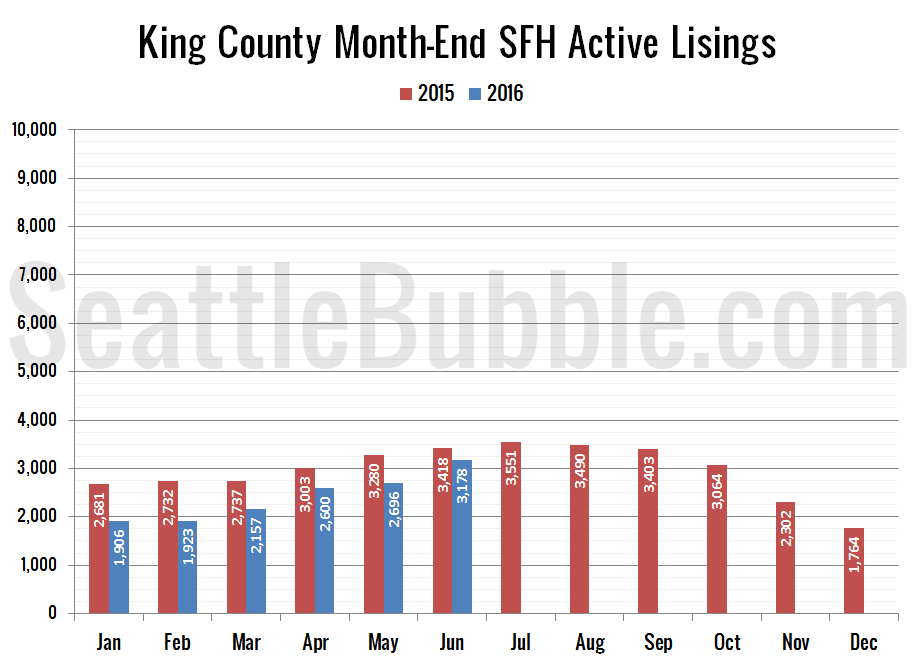
June was a mixed bag. Sales hit their highest level since 2007 in King County and a new all-time high in Snohomish County. Despite this, active listings saw unusually large month-over-month increases in both counties. Foreclosures are still at or near lows…
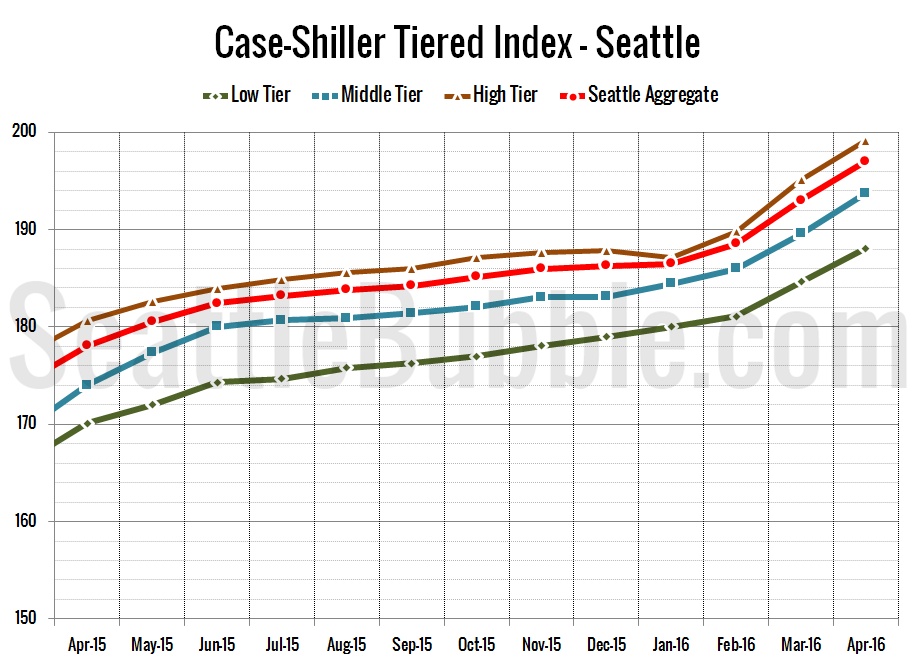
Case-Shiller Tiers: Only Low Tier Still Below Previous Peak
Let’s check out the three price tiers for the Seattle area, as measured by Case-Shiller.
Between March and April, the low tier increased 1.9 percent, the middle tier rose 2.2 percent, and the high tier was up 2.0 percent.
