Skip to content

Seattle Bubble

local real estate news, statistics, and commentary without the sales spin.

Menu
  • Home
  • About
  • Contact
  • Reference
  • Speaking
Menu

Category: Statistics

Statistics, number-based analysis, etc.

October Stats Preview: Inventory nearly doubles from 2017

Posted on November 1, 2018 by The Tim

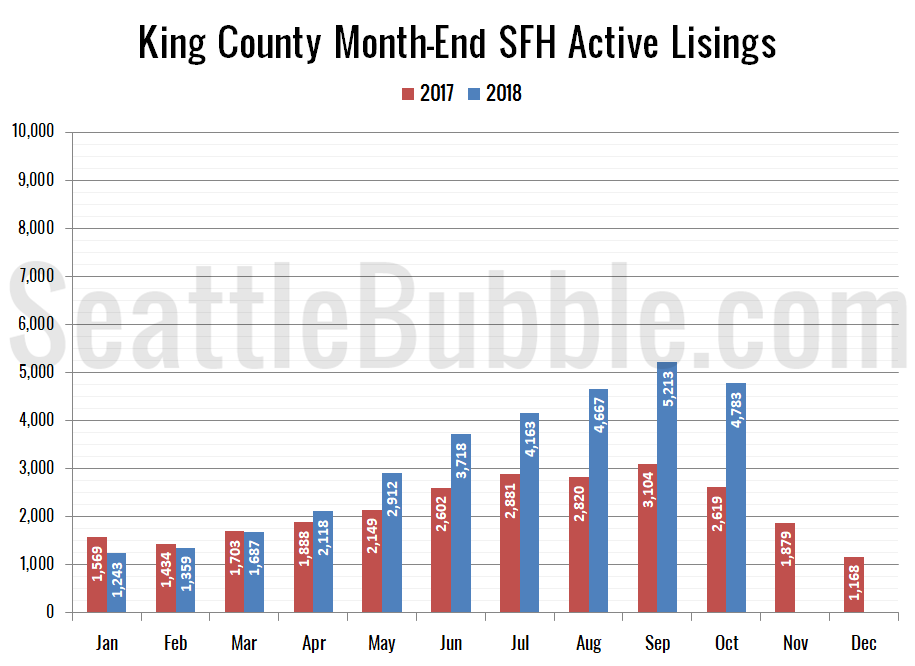
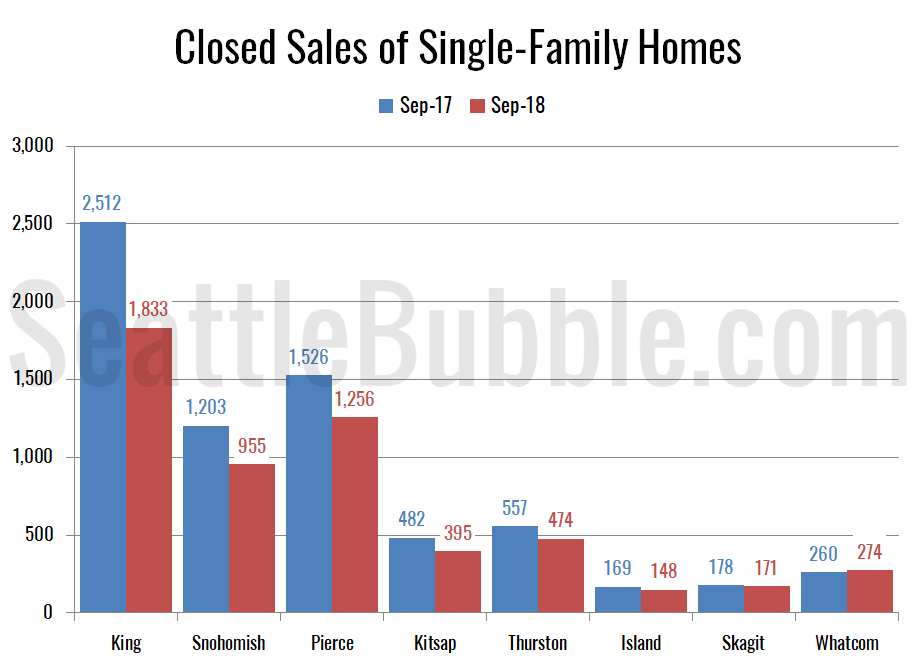
Home sales volume was down considerably from a year ago in both King and Snohomish County last month, dipping over 16 percent in both counties. Meanwhile, the number of homes on the market began the usual seasonal declines, but were still up 83 percent in King County and 63 percent in Snohomish. Foreclosures are still very rare, although the number of notices did tick up a bit month-over-month.

Share:

  • Twitter
  • LinkedIn
  • Facebook
  • Reddit
  • Pinterest
  • Email

Case-Shiller: Seattle home prices fell more than anywhere else between July and August.

Posted on October 30, 2018 by The Tim

Let’s have a look at the latest data from the Case-Shiller Home Price Index. According to July data that was released today, Seattle-area home prices were:

Down 1.6 percent July to August
Up 9.6 percent YOY.
Up 31.9 percent from the July 2007 peak

Last year at this time prices were down 0.3 percent month-over-month and year-over-year prices were up 13.2 percent.

Share:

  • Twitter
  • LinkedIn
  • Facebook
  • Reddit
  • Pinterest
  • Email

Real Estate Heat Index plummets in 2018—now at lowest level in over six years

Posted on October 10, 2018October 10, 2018 by The Tim

Like the charts and data that I’m posting? Want to support the ongoing work of this site? Good news, everyone! You can becoming a member of Seattle Bubble and get access to the data as well as other perks! We haven’t taken a look at my “Residential Real Estate Heat Index” for King County single-family…

Share:

  • Twitter
  • LinkedIn
  • Facebook
  • Reddit
  • Pinterest
  • Email

Around the Sound: Inventory growth, sales declines spread outside of King County

Posted on October 8, 2018October 8, 2018 by The Tim

With September’s stats in hand, let’s look at broader Puget Sound area. Here’s the latest update to our “Around the Sound” statistics for King, Snohomish, Pierce, Kitsap, Thurston, Island, Skagit, and Whatcom counties.
…
The biggest gains in new listings and active inventory are still in King County. Snohomish, Pierce, Kitsap and Thurston all also saw some decent gains in inventory, but in Island, Skagit, and Whatcom inventory was flat or still down. Meanwhile, closed sales are falling everywhere but Whatcom.

Share:

  • Twitter
  • LinkedIn
  • Facebook
  • Reddit
  • Pinterest
  • Email
Home Price Changes: May to September - Median Sale Price of King County Single-Family Homes

Home prices fell more between May and September this year than any previous year

Posted on October 5, 2018October 5, 2018 by The Tim

Between May and September this year, the median sale price of single-family homes in King County has fallen 8.0 percent. Most years home prices rise between May and September. The biggest decline between those months in previous years was 5.7 percent in 2008…

Share:

  • Twitter
  • LinkedIn
  • Facebook
  • Reddit
  • Pinterest
  • Email

Posts navigation

  • Previous
  • 1
  • …
  • 5
  • 6
  • 7
  • 8
  • 9
  • 10
  • 11
  • …
  • 222
  • Next

Tim’s Other Projects

Dispatches from the Multiverse

Tip Jar

Like what we're doing?

Drop us a tip!

Accounts

  • Log in
  • Entries feed
  • Comments feed
  • WordPress.org
©2024 Seattle Bubble | Built using WordPress and Responsive Blogily theme by Superb