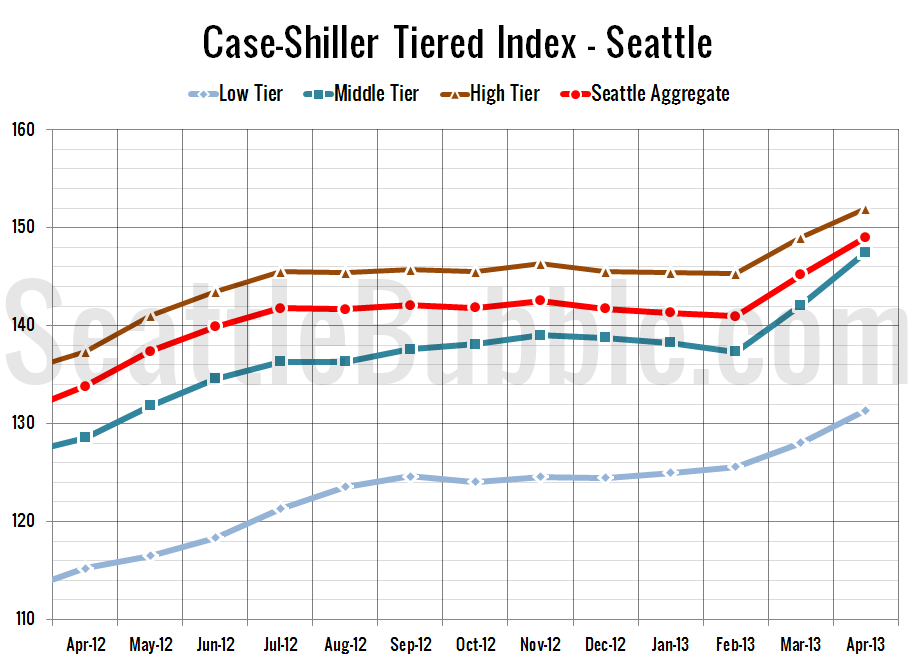
Let’s check out the three price tiers for the Seattle area, as measured by Case-Shiller. Remember, Case-Shiller’s “Seattle” data is based on single-family home repeat sales in King, Pierce, and Snohomish counties. Note that the tiers are determined by sale volume. In other words, 1/3 of all sales fall into each tier. For more details…
Category: Statistics
Statistics, number-based analysis, etc.
Case-Shiller: Seattle Home Prices Jumped Again in April
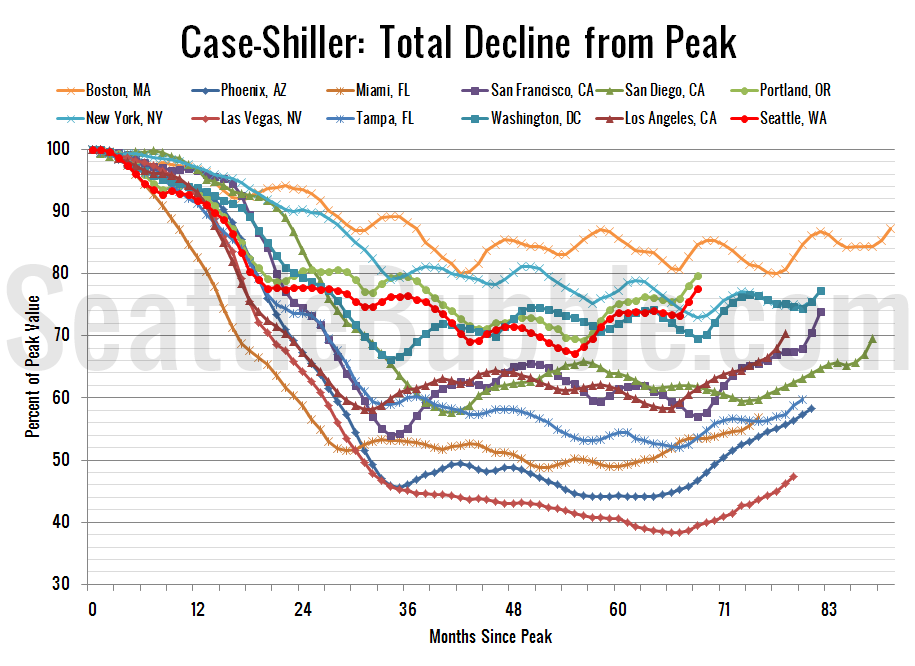
Let’s have a look at the latest data from the Case-Shiller Home Price Index. According to March data, Seattle-area home prices were: Up 2.7% March to April Up 11.4% YOY. Down 22.5% from the July 2007 peak Last year prices rose 2.0% from March to April and year-over-year prices were down 1.0%. Nothing surprising about…
Seattle-Area Price to Income Ratio Near Historic Average
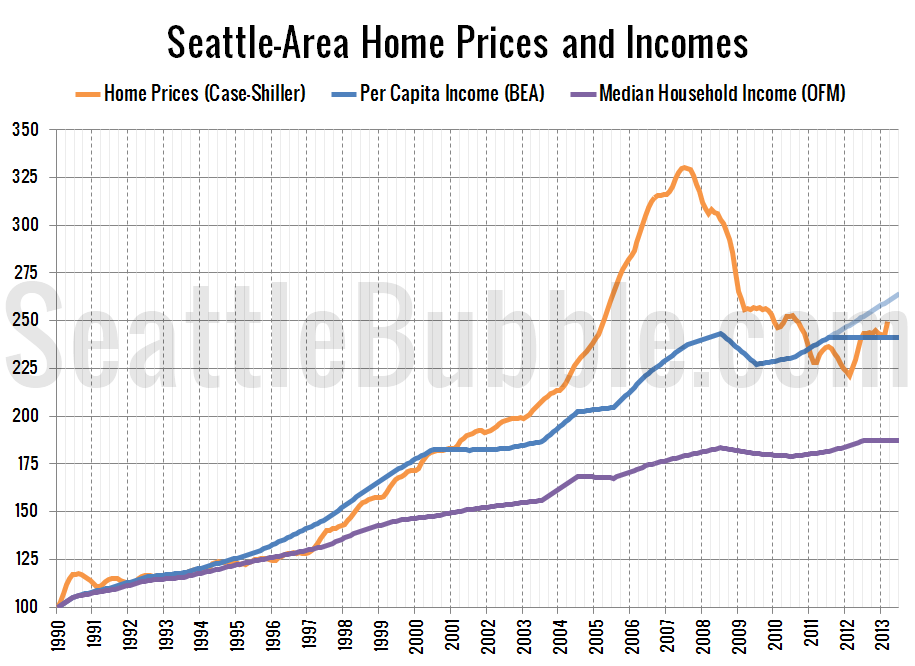
It’s been a while since we’ve taken look at how local home prices compare to local incomes, so let’s update those charts. First, let’s check out the ratio between home prices and per capita income from the BEA: Overall the Seattle area is just a little bit above the long-term average, and almost entirely thanks…
Seattle-Area Adds More Jobs, Unemployment Dips Below 5%
New local job stats came out this week, so let’s have a look at the Seattle area’s employment situation. First up, year-over-year job growth, broken down into a few relevant sectors: Construction growth dipped again, and has fallen from a 10.2% year-over-year gain in January to 3.1% in May. With 5.7% year-over-year growth, the retail…
Seattle Sales Gain, Cheap South King Sales Slip
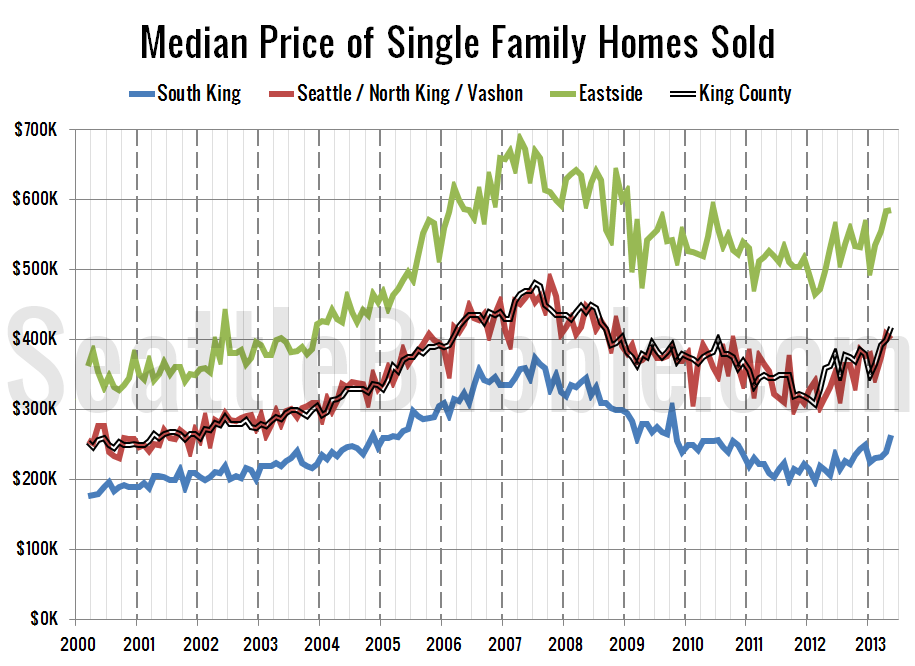
Let’s take an updated look at how King County’s sales are shifting between the different regions around the county, since geographic shifts can and do affect the median price. In order to explore this concept, we break King County down into three regions, based on the NWMLS-defined “areas”: low end: South County (areas 100-130 &…


