Skip to content

Seattle Bubble

local real estate news, statistics, and commentary without the sales spin.

Menu
  • Home
  • About
  • Contact
  • Reference
  • Speaking
Menu

Seattle Bubble 2014 Reader Census

Posted on March 17, 2014April 16, 2014 by The Tim

Attention readers: I would appreciate it if everyone could fill out this brief 2-minute survey.

Share:

  • Twitter
  • LinkedIn
  • Facebook
  • Reddit
  • Pinterest
  • Email

Poll: What’s your preferred kitchen countertop?

Posted on March 16, 2014March 24, 2014 by The Tim

This poll was active 03.16.2014 through 03.22.2014

Share:

  • Twitter
  • LinkedIn
  • Facebook
  • Reddit
  • Pinterest
  • Email

Foreclosures Fall Off Even More in February

Posted on March 14, 2014March 14, 2014 by The Tim

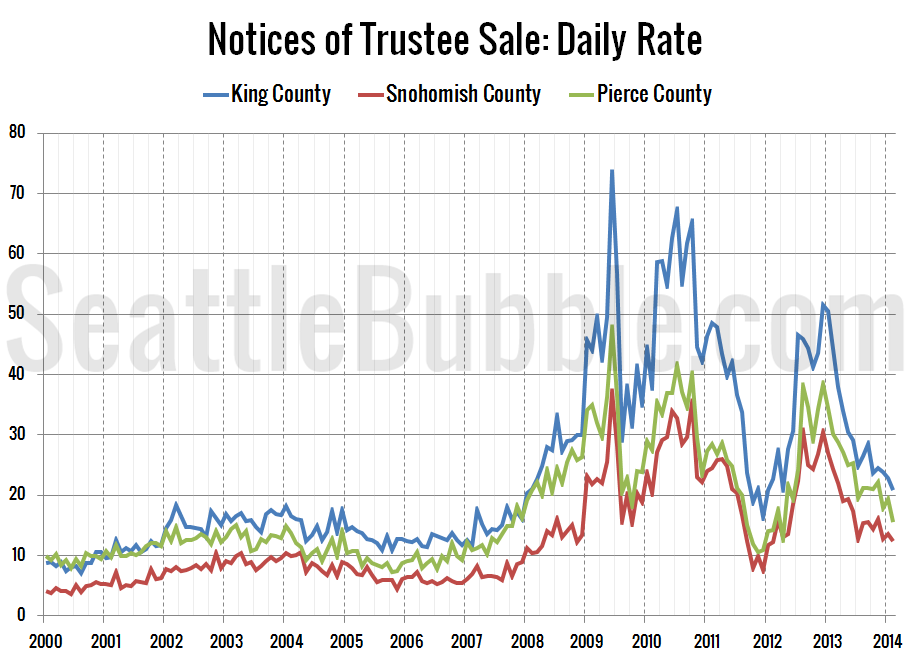
It’s time for our detailed look at January’s foreclosure stats in King, Snohomish, and Pierce counties. First up, the Notice of Trustee Sale summary: February 2013 King: 395 NTS, down 53% YOY Snohomish: 236 NTS, down 49% YOY Pierce: 297 NTS, down 48% YOY The number of trustee sale notices decreased significantly month-over-month and year-over-year…

Share:

  • Twitter
  • LinkedIn
  • Facebook
  • Reddit
  • Pinterest
  • Email

Around the Sound: Sales & Listings Moderated in February

Posted on March 13, 2014 by The Tim

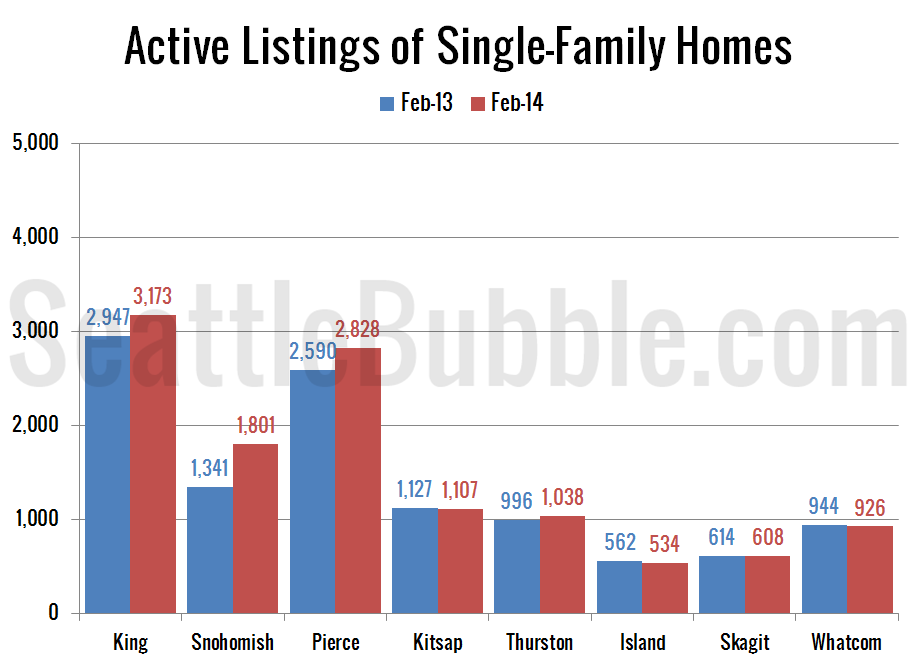
It’s time for us to check up on stats outside of the King/Snohomish core with our “Around the Sound” statistics for Pierce, Kitsap, Thurston, Island, Skagit, and Whatcom counties. If there is certain data you would like to see or ways you would like to see the data presented differently, drop a comment below and…

Share:

  • Twitter
  • LinkedIn
  • Facebook
  • Reddit
  • Pinterest
  • Email

Seattle Sales on the Rise, Eastside Slipping

Posted on March 11, 2014September 9, 2014 by The Tim

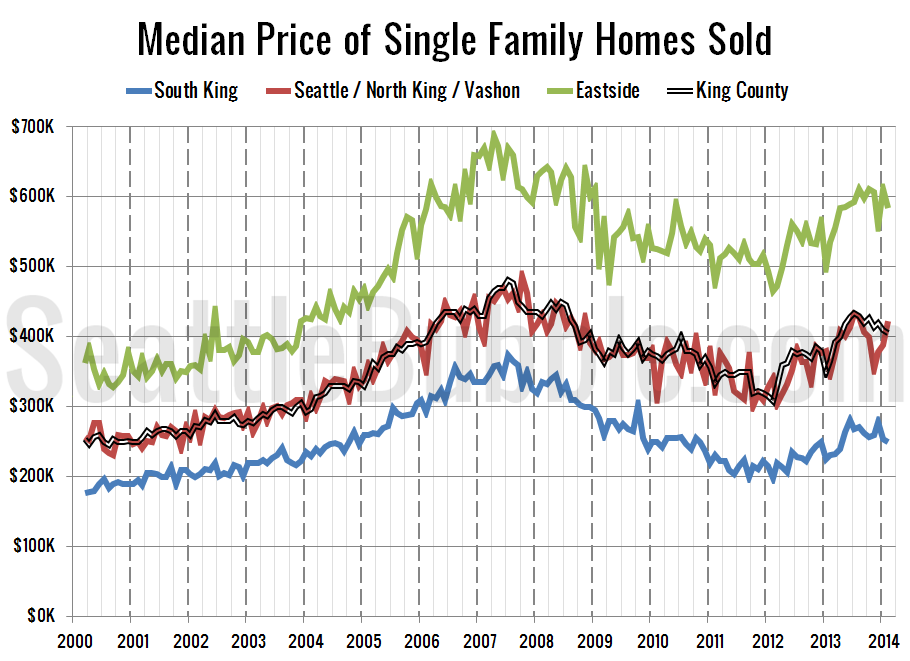
It’s time once again to take an updated look at how King County’s sales are shifting between the different regions around the county, since geographic shifts can and do affect the median price. In order to explore this concept, we break King County down into three regions, based on the NWMLS-defined “areas”: low end: South…

Share:

  • Twitter
  • LinkedIn
  • Facebook
  • Reddit
  • Pinterest
  • Email

Posts navigation

  • Previous
  • 1
  • …
  • 100
  • 101
  • 102
  • 103
  • 104
  • 105
  • 106
  • …
  • 717
  • Next

Tim’s Other Projects

Dispatches from the Multiverse

Current Market Stats

Charts courtesy Altos Research
Real Estate Market Chart by Altos Research www.altosresearch.com

Real Estate Market Chart by Altos Research www.altosresearch.com

Real Estate Market Chart by Altos Research www.altosresearch.com

Real Estate Market Chart by Altos Research www.altosresearch.com

News Categories

  • News (1,253)
    • Local (223)
    • National (46)
    • International (1)
    • Audio & Video (60)
    • Humor (43)
    • Opinion (88)
    • Uncategorized (314)
  • Features (558)
  • Statistics (1,109)
    • Counties (724)
    • Neighborhoods (100)
  • Economy (74)
  • Extras (491)
    • Polls (381)
    • Flickr Group (1)
    • Announcements (38)
    • Administrative (78)

Archives

Tip Jar

Like what we're doing?

Drop us a tip!

Accounts

  • Log in
  • Entries feed
  • Comments feed
  • WordPress.org
©2024 Seattle Bubble | Built using WordPress and Responsive Blogily theme by Superb