Skip to content

Seattle Bubble

local real estate news, statistics, and commentary without the sales spin.

Menu
  • Home
  • About
  • Contact
  • Reference
  • Speaking
Menu

Cheapest Homes: June 2013 Edition

Posted on June 4, 2013June 4, 2013 by The Tim

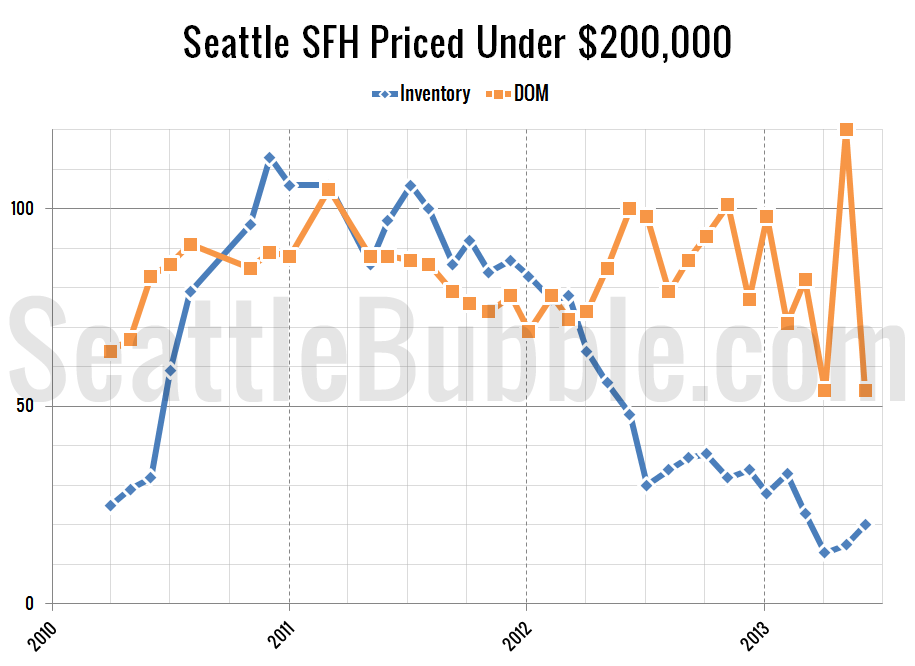
Let’s check in again on the cheapest homes around Seattle proper. Here’s our methodology: I search the listings for the cheapest homes currently on the market, excluding short sales, in the city of Seattle proper. Any properties that are in obvious states of extreme disrepair based on listing photos and descriptions will be excluded. This…

Share:

  • Twitter
  • LinkedIn
  • Facebook
  • Reddit
  • Pinterest
  • Email

May Stats Preview: Increasing Inventory & Sales Edition

Posted on June 3, 2013 by The Tim

Now that the month of May is behind us, let’s have a look at our stats preview. Most of the charts below are based on broad county-wide data that is available through a simple search of King County and Snohomish County public records. If you have additional stats you’d like to see in the preview,…

Share:

  • Twitter
  • LinkedIn
  • Facebook
  • Reddit
  • Pinterest
  • Email

Poll: Outside of work, I drive to my destinations…

Posted on June 2, 2013June 10, 2013 by The Tim

This poll was active 06.02.2013 through 06.08.2013

Share:

  • Twitter
  • LinkedIn
  • Facebook
  • Reddit
  • Pinterest
  • Email

Weekly Twitter Digest (Link Roundup) for 2013-05-31

Posted on June 1, 2013 by The Tim

"THE LONG WAIT: For many homeowners, mortgage relief can't come fast enough" http://t.co/5C3j1tYEfE via @PSBJ -> Polygon Northwest of Bellevue to take over the Everett Riverfront property by early July http://t.co/0xgdlKdGSW via @EverettHerald -> "Wells Fargo Center in downtown Seattle sold for $390M" http://t.co/eUmskdgucL via @PSBJ ->

Share:

  • Twitter
  • LinkedIn
  • Facebook
  • Reddit
  • Pinterest
  • Email

March 2013 Case-Shiller Potpourri

Posted on May 31, 2013September 4, 2013 by The Tim

Before we put away the Case-Shiller data for another month, let’s check in on a few of our alternative charts. First up, let’s take a look at the twenty-city month-over-month scorecard. Here’s the original post introducing this chart if you’d like more details. Click the image below for a super-wide version with the data back…

Share:

  • Twitter
  • LinkedIn
  • Facebook
  • Reddit
  • Pinterest
  • Email

Posts navigation

  • Previous
  • 1
  • …
  • 142
  • 143
  • 144
  • 145
  • 146
  • 147
  • 148
  • …
  • 717
  • Next

Tim’s Other Projects

Dispatches from the Multiverse

Current Market Stats

Charts courtesy Altos Research
Real Estate Market Chart by Altos Research www.altosresearch.com

Real Estate Market Chart by Altos Research www.altosresearch.com

Real Estate Market Chart by Altos Research www.altosresearch.com

Real Estate Market Chart by Altos Research www.altosresearch.com

News Categories

  • News (1,253)
    • Local (223)
    • National (46)
    • International (1)
    • Audio & Video (60)
    • Humor (43)
    • Opinion (88)
    • Uncategorized (314)
  • Features (558)
  • Statistics (1,109)
    • Counties (724)
    • Neighborhoods (100)
  • Economy (74)
  • Extras (491)
    • Polls (381)
    • Flickr Group (1)
    • Announcements (38)
    • Administrative (78)

Archives

Tip Jar

Like what we're doing?

Drop us a tip!

Accounts

  • Log in
  • Entries feed
  • Comments feed
  • WordPress.org
©2024 Seattle Bubble | Built using WordPress and Responsive Blogily theme by Superb