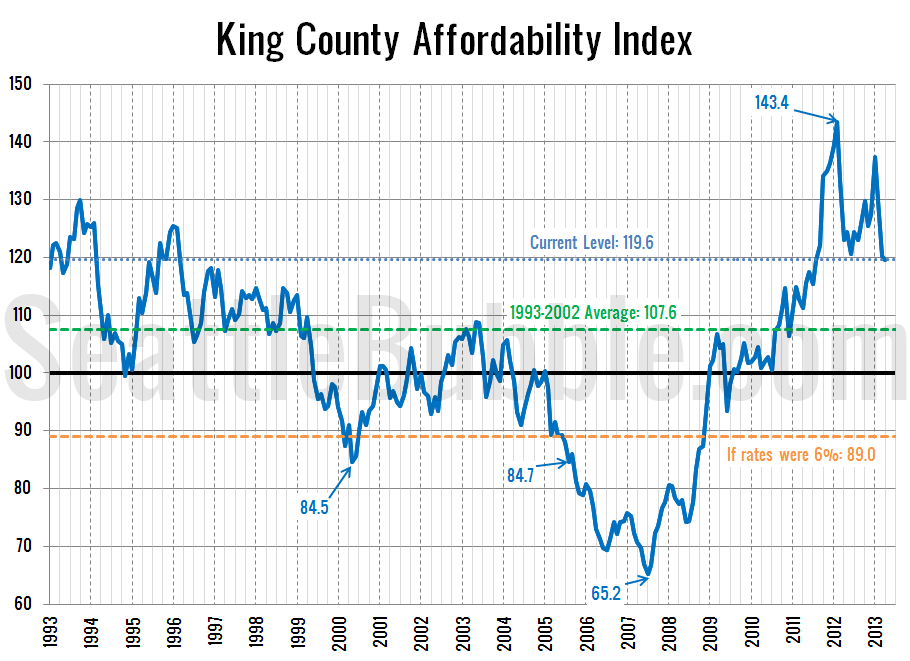
As promised in yesterday’s affordability post, here’s an updated look at the “affordable home” price chart. In this graph I flip the variables in the affordability index calculation around to other sides of the equation to calculate what price home the a family earning the median household income could afford to buy at today’s mortgage…
Home Affordability Tanking in 2013
It has been over four months since we had a look at the local affordability index, So let’s have a look at what the numbers look like with the price increases we’ve seen so far this year through April. As a reminder, the affordability index is based on three factors: median single-family home price as…
Cheap South King Sales Gain More Share
Let’s take an updated look at how King County’s sales are shifting between the different regions around the county, since geographic shifts can and do affect the median price. In order to explore this concept, we break King County down into three regions, based on the NWMLS-defined “areas”: low end: South County (areas 100-130 &…
Real Actual Listing Photos: Interesting “Features” Edition
It’s time for another installment of Real Actual Listing Photos. Once a month (or so) I round up some of the most bizarre listing photos from around the Seattle area and post them here, with brief excerpts from the real actual listing description, and probably a bit of snarky commentary. As usual, you should check…
Knife-Catcher: Year Two Recap of Tim’s Home Purchase
With two full years of home ownership/debtorship now behind me as of today, it’s time to share some more highlights, stats, and thoughts from year two. First up, the financial highlights from the first two years: Initial Loan Amount: $179,950 Current Loan Amount: $160,700 Total Spent in Year One: $24,294 Principal Paid: $8,907 Interest Paid:…