Skip to content

Seattle Bubble

local real estate news, statistics, and commentary without the sales spin.

Menu
  • Home
  • About
  • Contact
  • Reference
  • Speaking
Menu

Case-Shiller: Seattle Home Prices the hottest in the nation. Again.

Posted on July 25, 2017 by The Tim

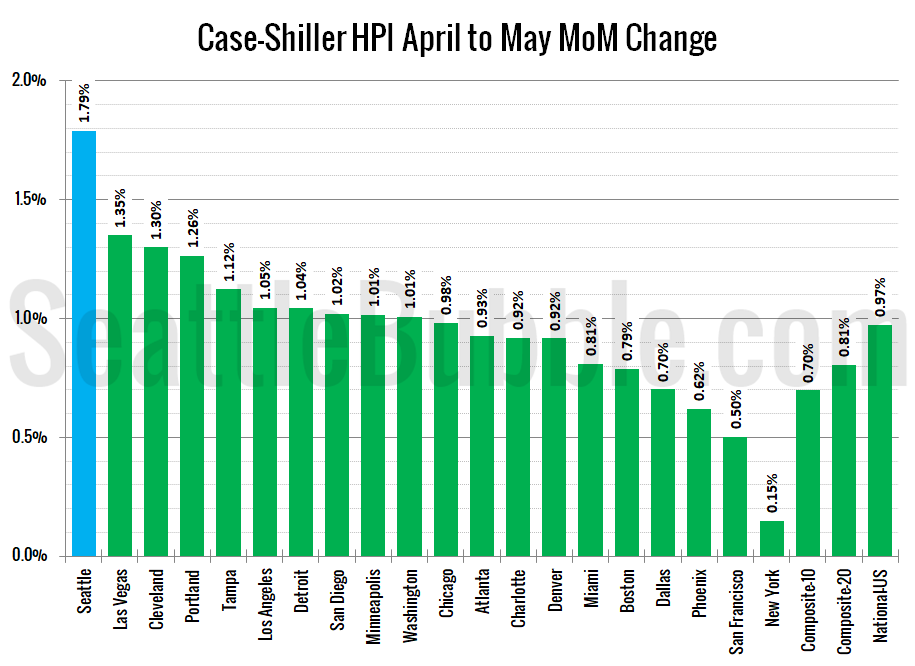
Let’s have a look at the latest data from the Case-Shiller Home Price Index. According to March data that was released this morning, Seattle-area home prices were:

Up 1.8 percent April to May
Up 13.3 percent year-over-year.
Up 17.7 percent from the July 2007 peak

Over the same period last year prices were up 1.4 percent month-over-month and year-over-year prices were up 10.7 percent.

Home price growth in Seattle as measured by Case-Shiller show no signs of slowing. Seattle leads the nation yet again in month-over-month and year-over-year home price growth. Thanks, Amazon.
Read the full post…

Share:

  • Share on X (Opens in new window) X
  • Share on LinkedIn (Opens in new window) LinkedIn
  • Share on Facebook (Opens in new window) Facebook
  • Share on Reddit (Opens in new window) Reddit
  • Share on Pinterest (Opens in new window) Pinterest
  • Email a link to a friend (Opens in new window) Email
King Co. SFH New Listing Absorption Rate

New Listing Absorption Dropping Rapidly From December High

Posted on July 12, 2017July 12, 2017 by The Tim

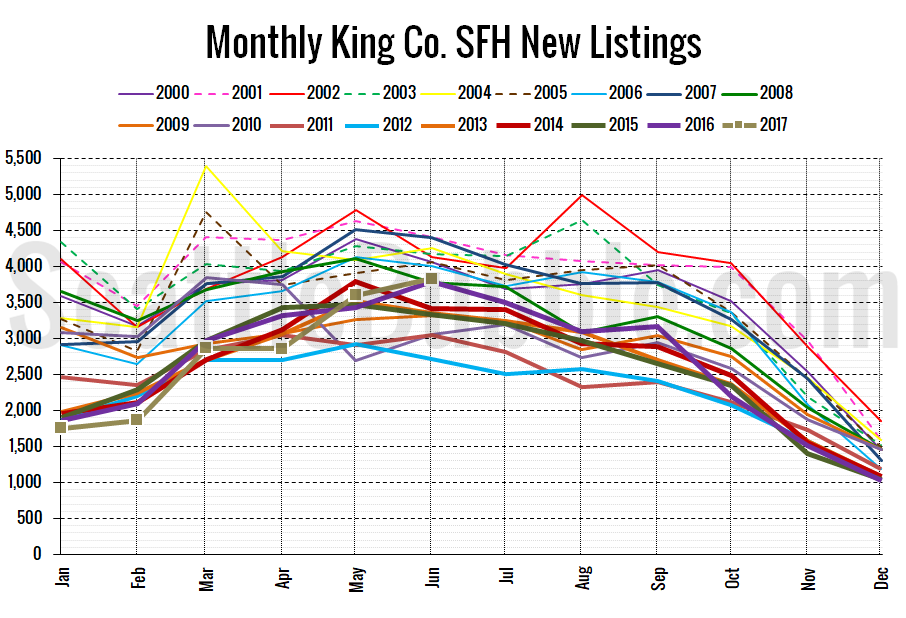
By request, here are a few alternative takes on recent home listing activity. Since one of the biggest issues driving the current crazy market is a lack of enough home listings, we can get an idea of whether or not there is any relief on the horizon for buyers by looking at listing activity.

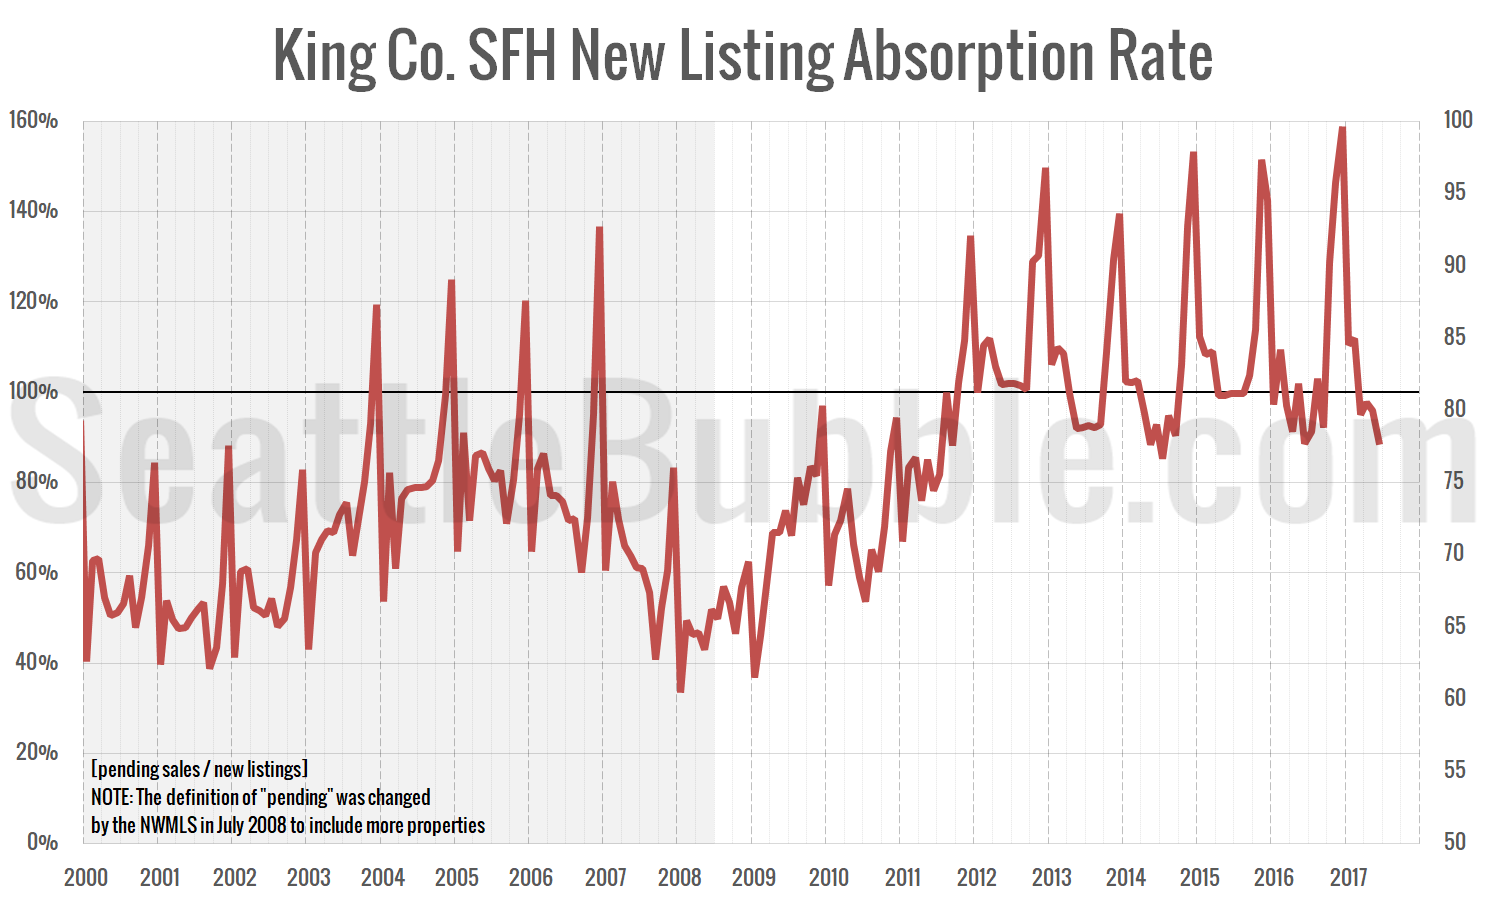
First up, here’s a chart I just created: New listing absorption. This is a simple look at the ratio of pending sales to new listings. If more homes are going pending in a month than there are being listed, this ratio goes above 100 percent, which is obviously not great for buyers.

…what’s interesting to me about this chart is that just last December we saw new listing absorption an all-time high of 159%, while as of June it has fallen to almost the lowest level since the market bottomed out in 2011. However, this is obviously a very seasonal metric, and the low point for the year usually comes in June or July, so it would not be surprising if this is the lowest level we see this year.

Read the full post…

Share:

  • Share on X (Opens in new window) X
  • Share on LinkedIn (Opens in new window) LinkedIn
  • Share on Facebook (Opens in new window) Facebook
  • Share on Reddit (Opens in new window) Reddit
  • Share on Pinterest (Opens in new window) Pinterest
  • Email a link to a friend (Opens in new window) Email
City of Seattle Population Growth

NWMLS Falsely Inflates Seattle’s Population Growth

Posted on July 7, 2017July 8, 2017 by The Tim

It’s time once again for a reporting roundup, where you can read my wry commentary about the news instead of subjecting yourself to boring rehashes of the NWMLS press release (or in addition to, if that’s what floats your boat).
…
For a month that saw home prices shoot up to insane new all-time highs, the quotes from home salesmen in this month’s release are surprisingly calm.

I do want to address one glaring error in the release, though:

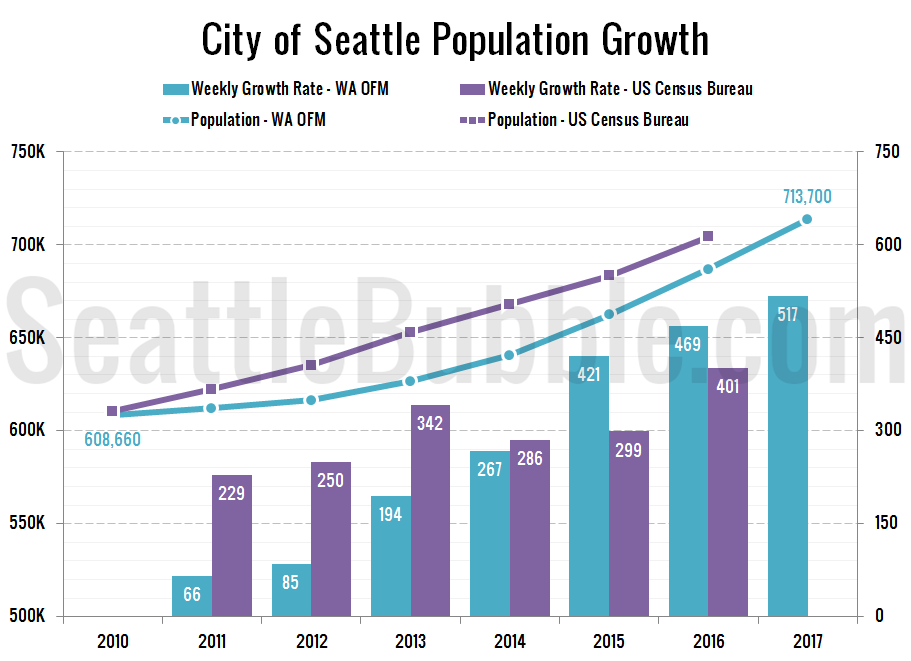
Seattle’s growing population is another likely factor. Recent U.S. Census Bureau data shows Seattle is gaining about 1,100 residents per week, an “astounding” figure, said MLS director Diedre Haines.

That number is false. The most recent data available shows a growth rate of less than half that level…

Read the full post…

Share:

  • Share on X (Opens in new window) X
  • Share on LinkedIn (Opens in new window) LinkedIn
  • Share on Facebook (Opens in new window) Facebook
  • Share on Reddit (Opens in new window) Reddit
  • Share on Pinterest (Opens in new window) Pinterest
  • Email a link to a friend (Opens in new window) Email

NWMLS: Prices are obscene and the market is still stupidly hot, but June saw a record high monthly increase in inventory

Posted on July 6, 2017July 6, 2017 by The Tim

June market stats have been published by the NWMLS. Their press release hasn’t been published yet, so maybe we’ll do a reporting roundup tomorrow and take a look at Lennox Scott’s breathless Lereah-esque bloviations.

For now, let’s just dive into the numbers for June.
…
New listings are coming on at a decent pace and inventory actually saw a decent increase, but buyers are still snatching up most listings very quickly. The average time on market in King County for single-family home sales that closed in June was just 17 days—an all-time low…

Read the full post…

Share:

  • Share on X (Opens in new window) X
  • Share on LinkedIn (Opens in new window) LinkedIn
  • Share on Facebook (Opens in new window) Facebook
  • Share on Reddit (Opens in new window) Reddit
  • Share on Pinterest (Opens in new window) Pinterest
  • Email a link to a friend (Opens in new window) Email

June Stats Preview: Listings Inch Up, Sales Still Strong

Posted on July 5, 2017July 5, 2017 by The Tim

Let’s take a look at regular monthly “preview” charts. Now that June is in the past let’s take a look at the local housing market stats for the month. Short story: Inventory bumped up slightly, but is still in the gutter. Sales are still very strong.

…

Listings are still very scarce, but at least they’ve bumped up quite a bit from the all-time low. Sales are strong, and hit their highest point since sometime before 2009 in Snohomish County.

Read the full post…

Share:

  • Share on X (Opens in new window) X
  • Share on LinkedIn (Opens in new window) LinkedIn
  • Share on Facebook (Opens in new window) Facebook
  • Share on Reddit (Opens in new window) Reddit
  • Share on Pinterest (Opens in new window) Pinterest
  • Email a link to a friend (Opens in new window) Email

Posts pagination

  • Previous
  • 1
  • …
  • 19
  • 20
  • 21
  • 22
  • 23
  • 24
  • 25
  • …
  • 717
  • Next

Tim’s Other Projects

Dispatches from the Multiverse

Current Market Stats

Charts courtesy Altos Research
Real Estate Market Chart by Altos Research www.altosresearch.com

Real Estate Market Chart by Altos Research www.altosresearch.com

Real Estate Market Chart by Altos Research www.altosresearch.com

Real Estate Market Chart by Altos Research www.altosresearch.com

News Categories

  • News (1,255)
    • Local (223)
    • National (46)
    • International (1)
    • Audio & Video (60)
    • Humor (43)
    • Opinion (90)
    • Uncategorized (314)
  • Features (558)
  • Statistics (1,109)
    • Counties (724)
    • Neighborhoods (100)
  • Economy (74)
  • Extras (491)
    • Polls (381)
    • Flickr Group (1)
    • Announcements (38)
    • Administrative (78)

Archives

Tip Jar

Like what we're doing?

Drop us a tip!

Accounts

  • Log in
  • Entries feed
  • Comments feed
  • WordPress.org
©2026 Seattle Bubble | Built using WordPress and Responsive Blogily theme by Superb