Skip to content

Seattle Bubble

local real estate news, statistics, and commentary without the sales spin.

Menu
  • Home
  • About
  • Contact
  • Reference
  • Speaking
Menu

High Seattle Home Prices Now The Subject Of Tasteless Bus Ads

Posted on May 12, 2017May 12, 2017 by The Tim

This bus ad was spotted by Redditor /u/moroccahamed on /r/SeattleWA:

[caption id="attachment_104531" align="alignnone" width="720"]Tasteless Codefellows Bus Ad You know who can afford a house in Seattle? SOFTWARE DEVELOPERS.[/caption]

I feel like an ad like this is more likely to add to the already high level of animosity toward software developers than it is to get people to sign up for a coding academy…

Share:

  • Twitter
  • LinkedIn
  • Facebook
  • Reddit
  • Pinterest
  • Email

Sales Fall Off In Cheap King County Neighborhoods

Posted on May 9, 2017May 9, 2017 by The Tim

It’s been a few months since we took a look at the in-county breakdown data from the NWMLS to see how the sales mix shifted around the county. I like to keep an eye on this not only to see how individual neighborhoods are doing but also to see how the sales mix shift affects the overall county-wide median price.

In order to explore this concept, we break King County down into three regions, based on the NWMLS-defined “areas”:

  • low end: South County (areas 100-130 & 300-360)
  • mid range: Seattle / North County (areas 140, 380-390, & 700-800)
  • high end: Eastside (areas 500-600)

Here’s where each region’s median prices came in as of April data:

  • low end: $330,000-$520,000
  • mid range: $559,950-$964,250
  • high end: $699,475-$2,203,000

First up, let’s have a look at each region’s (approximate) median price (actually the median of the medians for each area within the region)…

Share:

  • Twitter
  • LinkedIn
  • Facebook
  • Reddit
  • Pinterest
  • Email

NWMLS: Home Prices Hit New Highs, Listings Still Scarce

Posted on May 5, 2017May 5, 2017 by The Tim

April market stats have been published by the NWMLS yesterday. Here’s their press release: Shrinking inventory putting “stranglehold” on sales

You can practically hear OB Jacobi and J. Lennox Scott drooling over all those sweet, sweet high commissions. At least George Moorhead seems relatively level-headed, pointing out that prices might be getting a bit out of control.

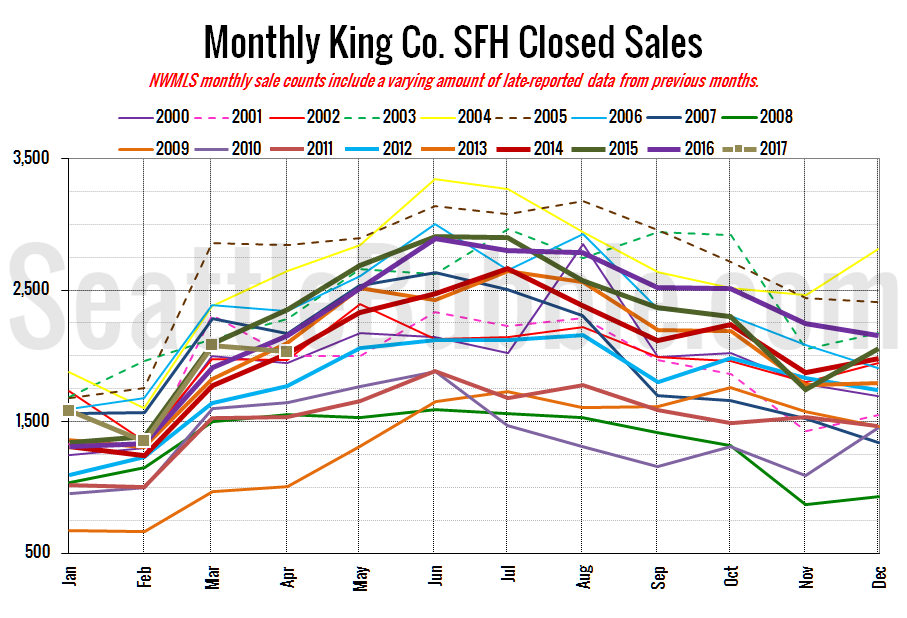
Pending sales have been down year-over-year for three months in a row, and now closed sales have finally declined year-over-year as well. That said, even with the drop, closed sales in April came out higher than the April level in thirteen of the last twenty-four years. Given the continued extreme shortage of inventory, it’s no surprise then that strong demand + very low supply = surging prices.

Share:

  • Twitter
  • LinkedIn
  • Facebook
  • Reddit
  • Pinterest
  • Email

April Stats Preview: Sales Slip As Inventory Shortage Drags On

Posted on May 5, 2017 by The Tim

NWMLS posted their stats yesterday, but I still want to share the regular monthly “preview” charts here. Now that April done let’s take a look at the local housing market stats for the month. Short story: Inventory is still almost non-existent, and it seems to be finally putting somewhat of a damper on sales.

Sales slipped slightly between March and April in both counties. Listings increased month-over-month, but it was a very weak gain for this time of year.

Share:

  • Twitter
  • LinkedIn
  • Facebook
  • Reddit
  • Pinterest
  • Email

Case-Shiller: Seattle-Area Home Prices Surged In February

Posted on April 25, 2017April 25, 2017 by The Tim

Let’s have a look at the latest data from the Case-Shiller Home Price Index. According to February data that was released this morning, Seattle-area home prices were:

Up 1.9 percent January to February
Up 12.2 percent year-over-year.
Up 10.0 percent from the July 2007 peak

Over the same period a year earlier prices were up 1.1 percent month-over-month and year-over-year prices were up 10.7 percent.

Seattle home prices as measured by Case-Shiller shot up yet again to a new all-time high in February.

Share:

  • Twitter
  • LinkedIn
  • Facebook
  • Reddit
  • Pinterest
  • Email

Posts navigation

  • Previous
  • 1
  • …
  • 21
  • 22
  • 23
  • 24
  • 25
  • 26
  • 27
  • …
  • 717
  • Next

Tim’s Other Projects

Dispatches from the Multiverse

Current Market Stats

Charts courtesy Altos Research
Real Estate Market Chart by Altos Research www.altosresearch.com

Real Estate Market Chart by Altos Research www.altosresearch.com

Real Estate Market Chart by Altos Research www.altosresearch.com

Real Estate Market Chart by Altos Research www.altosresearch.com

News Categories

  • News (1,253)
    • Local (223)
    • National (46)
    • International (1)
    • Audio & Video (60)
    • Humor (43)
    • Opinion (88)
    • Uncategorized (314)
  • Features (558)
  • Statistics (1,109)
    • Counties (724)
    • Neighborhoods (100)
  • Economy (74)
  • Extras (491)
    • Polls (381)
    • Flickr Group (1)
    • Announcements (38)
    • Administrative (78)

Archives

Tip Jar

Like what we're doing?

Drop us a tip!

Accounts

  • Log in
  • Entries feed
  • Comments feed
  • WordPress.org
©2024 Seattle Bubble | Built using WordPress and Responsive Blogily theme by Superb