A short note unrelated to real estate: If you enjoy puzzle-solving and competition, I’m hosting a big Seattle scavenger hunt next month that you will probably enjoy.
Put together your team and sign up before July 27th to get the early bird price.
local real estate news, statistics, and commentary without the sales spin.
A short note unrelated to real estate: If you enjoy puzzle-solving and competition, I’m hosting a big Seattle scavenger hunt next month that you will probably enjoy.
Put together your team and sign up before July 27th to get the early bird price.
It’s time once again for the monthly reporting roundup, where you can read my wry commentary about the news instead of subjecting yourself to boring rehashes of the NWMLS press release (or in addition to, if that’s what floats your boat).
To kick things off, here’s an excerpt from the NWMLS press release…
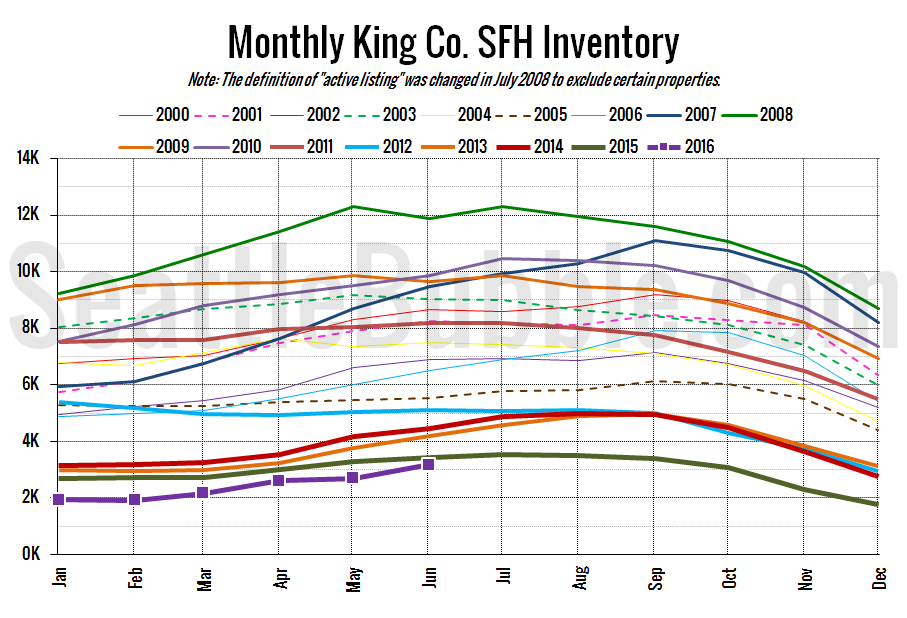
June market stats were published by the NWMLS this morning. The NWMLS press release hasn’t been posted yet, so we’ll cover that tomorrow. On with the stats!
It’s still a bit early to say that we’re turning a corner, but while the overall level of inventory is still at all-time lows for this time of year, the rate of year-over-year change has been getting slightly better every month since December…
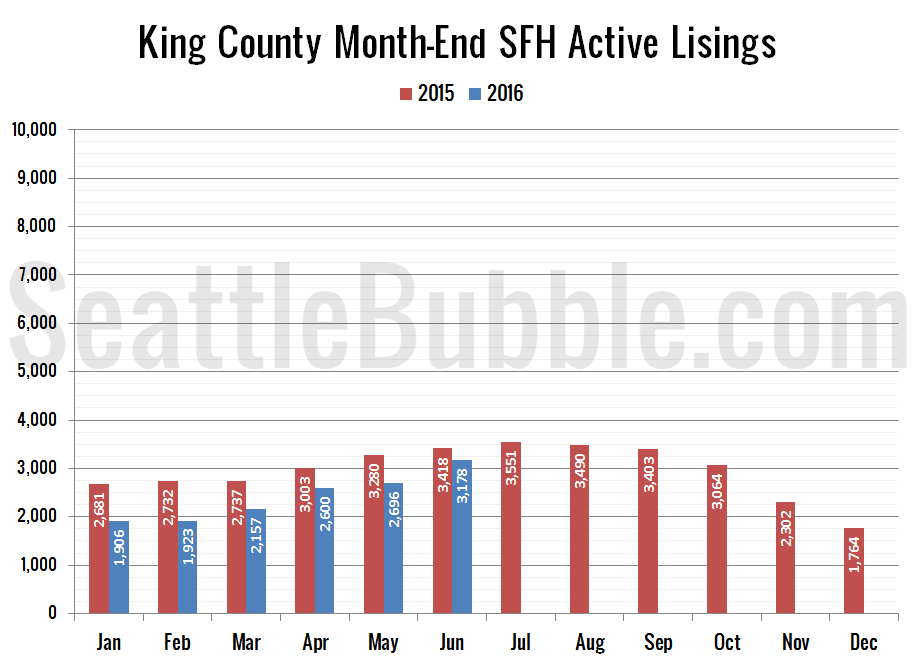
Now that June is behind us, let’s have our first look at how the month’s real estate stats stack up.
June was a mixed bag. Sales hit their highest level since 2007 in King County and a new all-time high in Snohomish County. Despite this, active listings saw unusually large month-over-month increases in both counties. Foreclosures are still at or near lows…
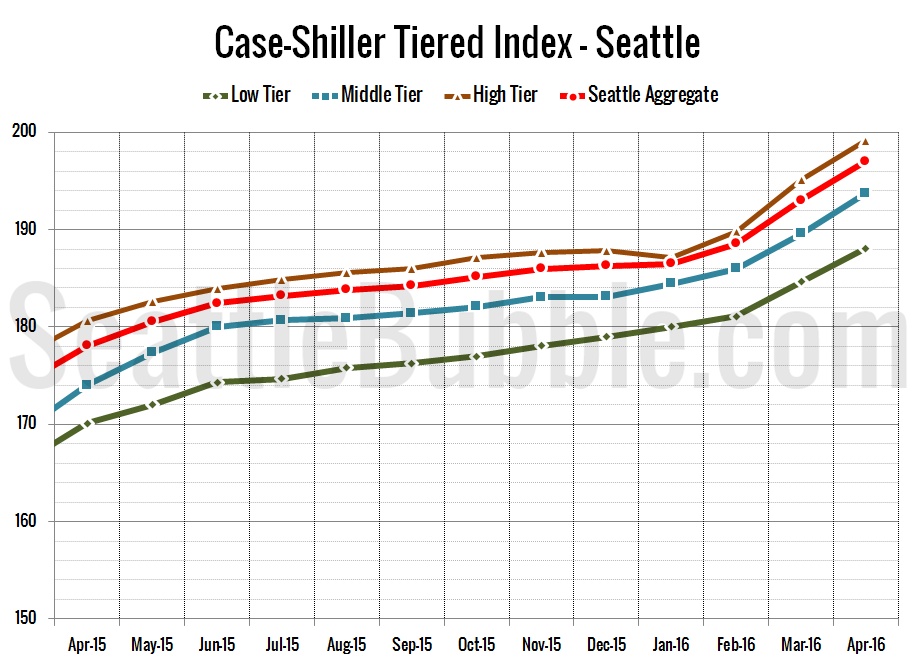
Let’s check out the three price tiers for the Seattle area, as measured by Case-Shiller.
Between March and April, the low tier increased 1.9 percent, the middle tier rose 2.2 percent, and the high tier was up 2.0 percent.