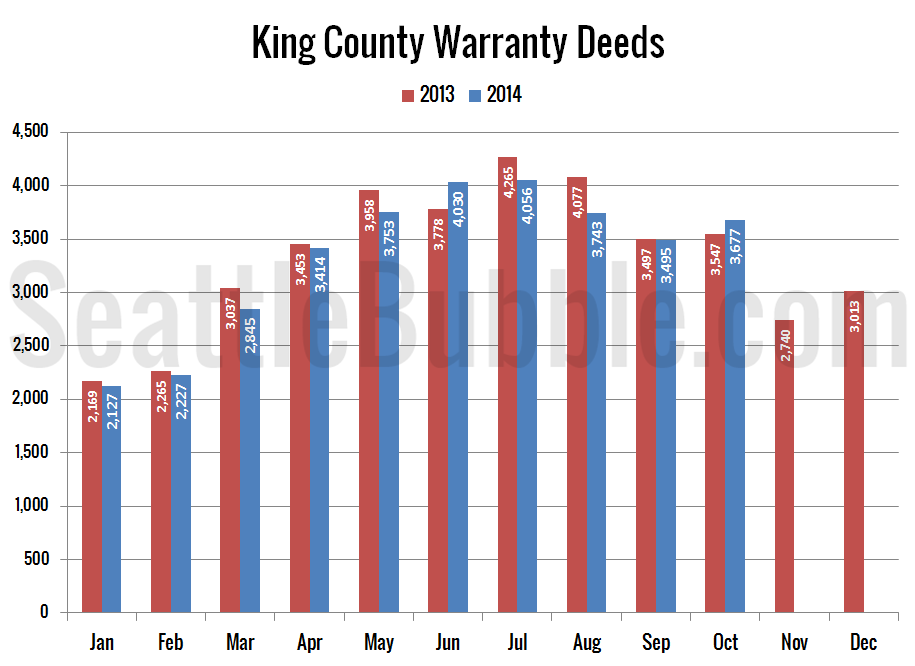
With October now in the past, let’s have a look at our monthly stats preview. Most of the charts below are based on broad county-wide data that is available through a simple search of King County and Snohomish County public records. If you have additional stats you’d like to see in the preview, drop a…
Poll: Seattle Bubble’s New Look Is…
This poll was active 11.02.2014 through 11.08.2014
Guess the Price Round 8: We Have a Winner!
Just over a month ago we launched our latest price-guessing contest: Guess the Price Round 8: Wallingford Craftsman. Thirty readers made guesses this round before the home went pending. Today’s “Guess the Price” guest star is 3724 Corliss Ave N in the southern third of North Seattle’s Wallingford neighborhood, close to the Burke-Gilman Trail and…
Price Gains Shrinking in All Twenty Case-Shiller Cities
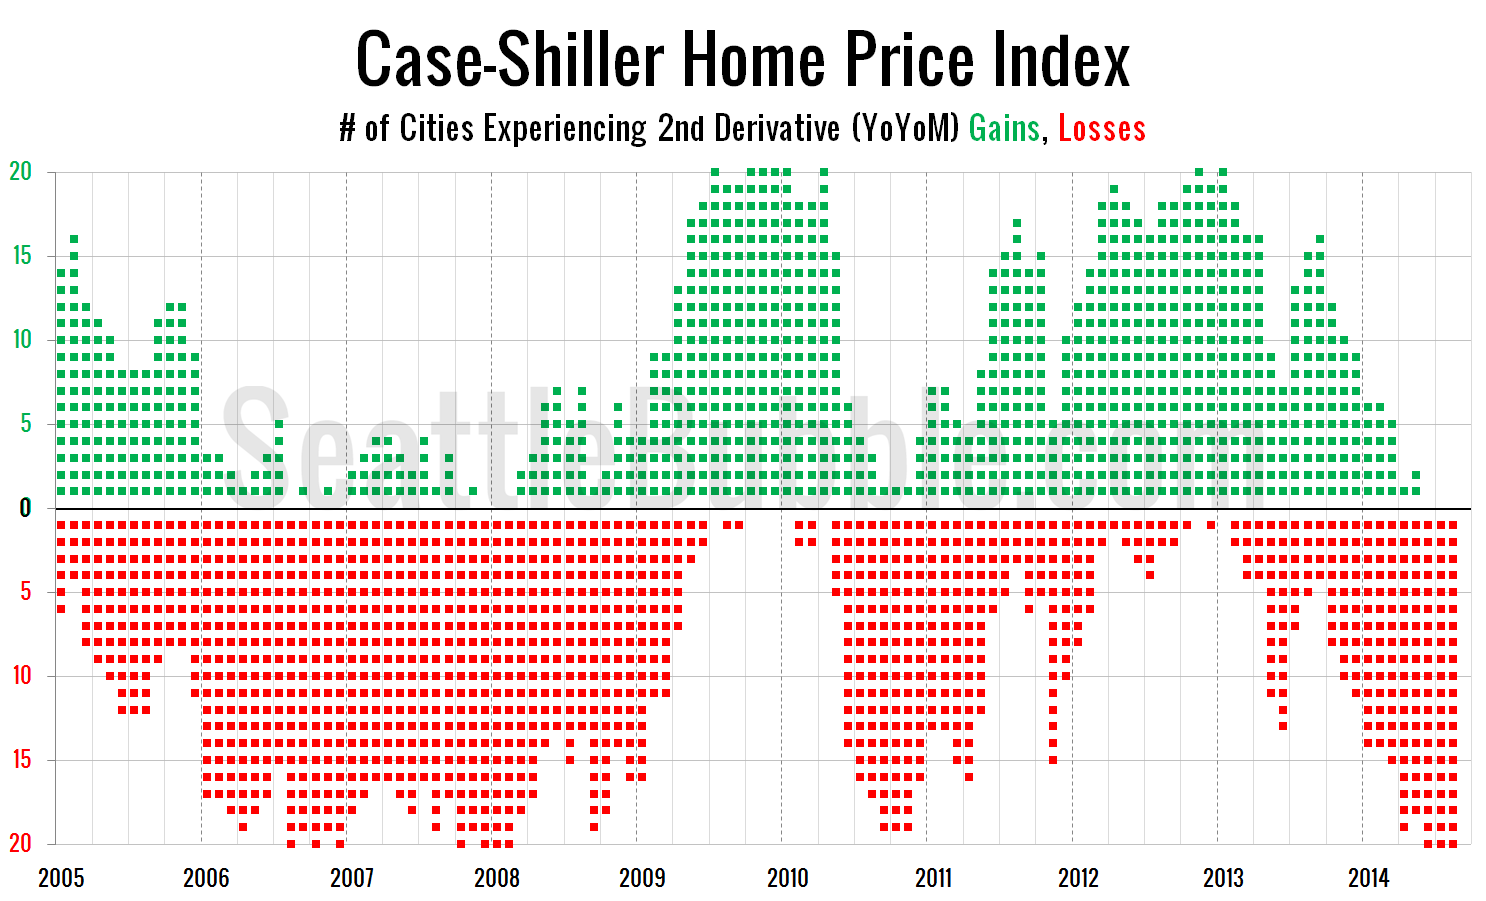
It’s been a few months since we last had a look at my favorite alternative Case-Shiller charts. First up, let’s have a look at the chart that depicts the count of cities showing second derivative (month-over-month changes in the year-over-year changes) gains or losses. For the last three months of data, every single city has…
Case-Shiller Tiers: High Tier Leads Autumn Decline
Let’s check out the three price tiers for the Seattle area, as measured by Case-Shiller. Remember, Case-Shiller’s “Seattle” data is based on single-family home repeat sales in King, Pierce, and Snohomish counties. Note that the tiers are determined by sale volume. In other words, 1/3 of all sales fall into each tier. For more details…