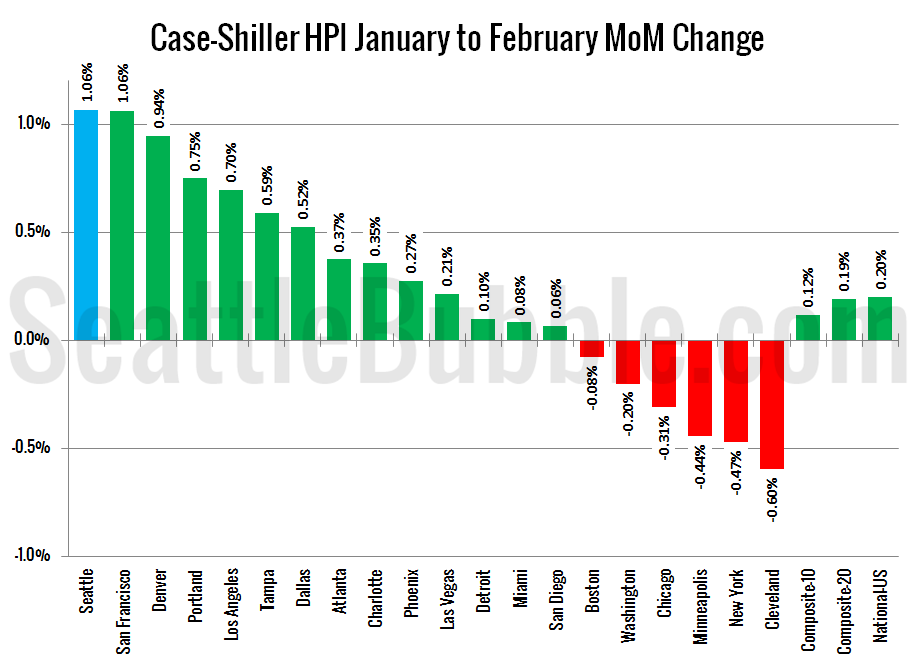
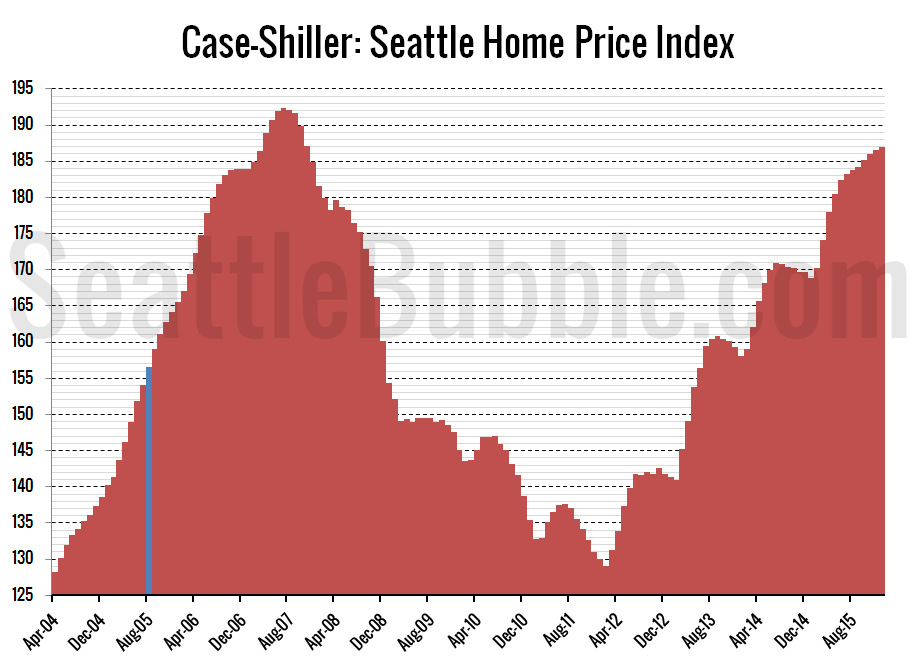
Let’s have a look at the latest data from the Case-Shiller Home Price Index. According to January data that was released today, Seattle-area home prices were: Up 1.1 percent January to February Up 11.0 percent YOY. Down 1.7 percent from the July 2007 peak Over the same period last year prices were up 0.9 percent…