Skip to content

Seattle Bubble

local real estate news, statistics, and commentary without the sales spin.

Menu
  • Home
  • About
  • Contact
  • Reference
  • Speaking
Menu

Tag: sales

New listing absorption softens more as pending sales slip

Posted on September 18, 2018October 1, 2018 by The Tim

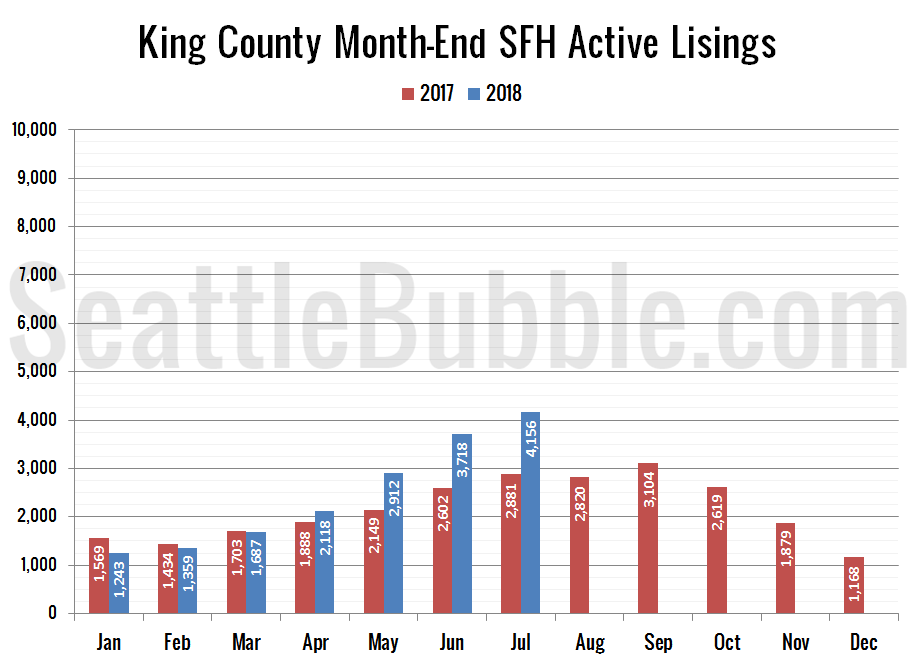
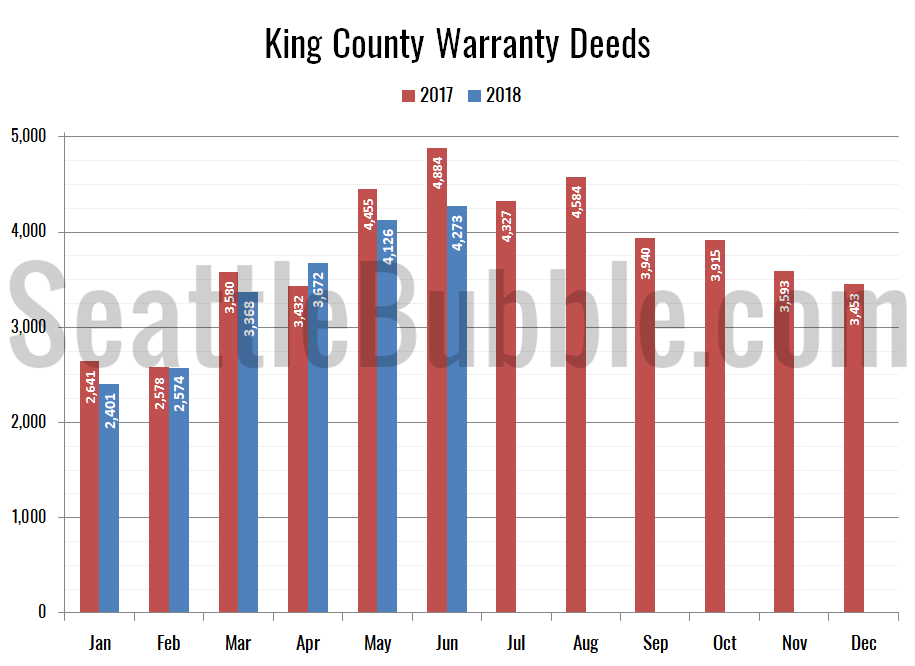
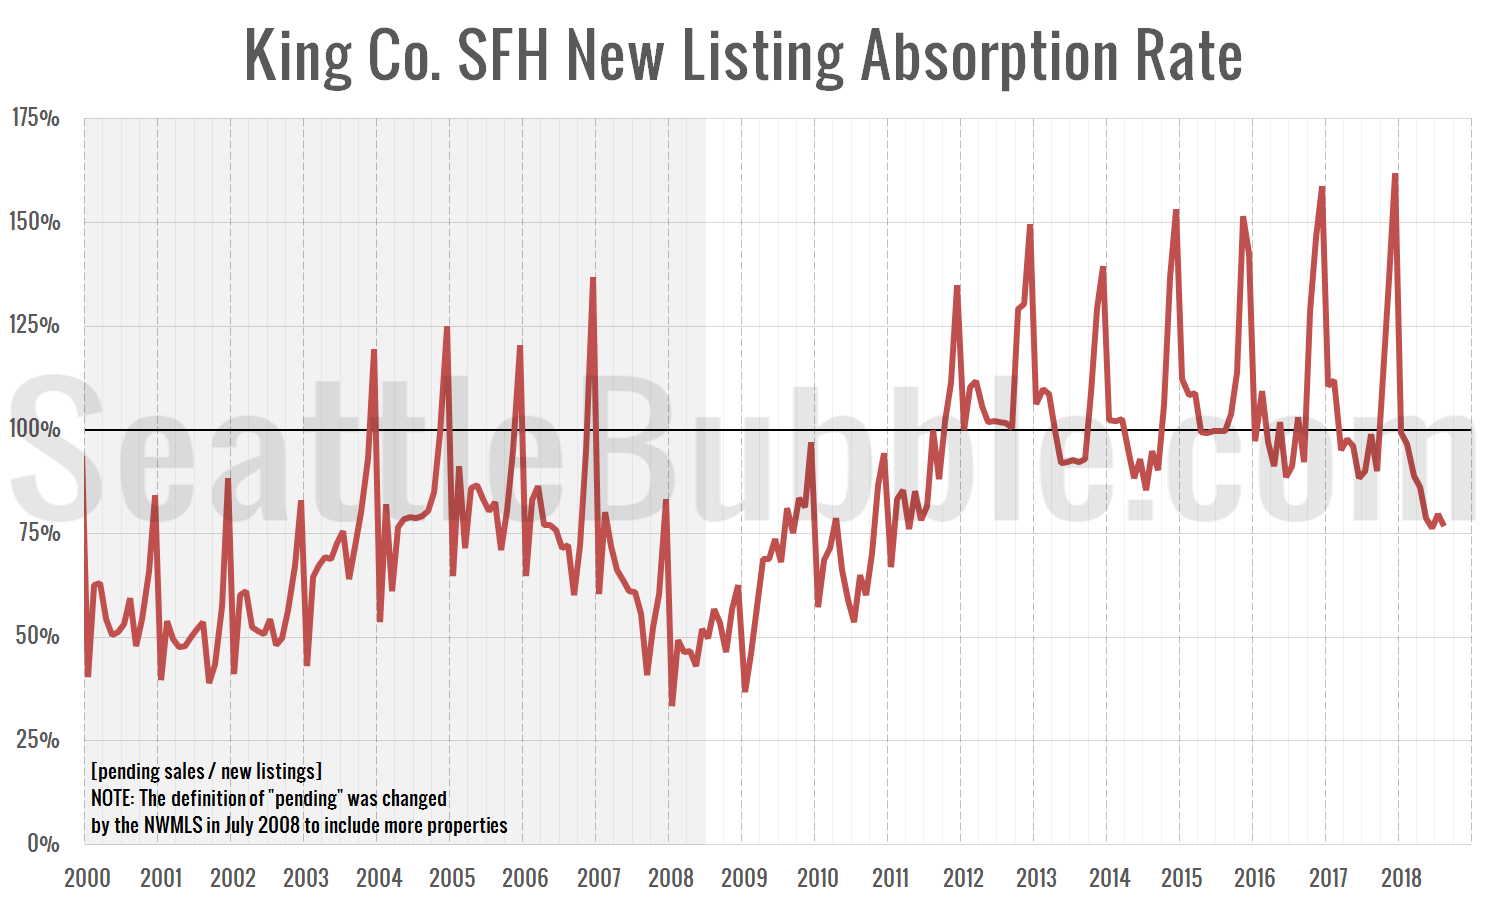
I’ve got a few charts to update you with, but let’s start with a few charts that sum up the state of King County single-family listings, inventory, and pending sales.

After five or six years of the same story month after month—fewer listings, more sales, soaring prices—the market has definitely turned in 2018. Pending sales are now on the decline and inventory is rising rapidly. Let’s see what this looks like in charts…

Share:

  • Twitter
  • LinkedIn
  • Facebook
  • Reddit
  • Pinterest
  • Email

July Stats Preview: The 2018 Listings Surge Continues

Posted on August 2, 2018 by The Tim

The 2018 listings surge continued in July, with on-market single-family inventory hitting its highest level since October 2013.

Here’s the overall summary for July: Sales fell both month-over-month and year-over-year. Listings shot up yet again. Foreclosures are still at all-time lows.

Share:

  • Twitter
  • LinkedIn
  • Facebook
  • Reddit
  • Pinterest
  • Email

June Stats Preview: Listings surge even higher in June

Posted on July 2, 2018July 2, 2018 by The Tim

Last month we noticed a big surge in listings in King County in our preview data for May, and in June it looks like the trend is getting stronger. On-market listings of single-family homes nearly hit their highest point in four years in June, surging 28 percent in a single month.

The overall summary for June is that sales edged up from May, but saw the biggest year-over-year decline since April 2011. Listings shot up and are starting to form a very interesting trend. Foreclosures are still few and far between.

Share:

  • Twitter
  • LinkedIn
  • Facebook
  • Reddit
  • Pinterest
  • Email

Around the Sound: King County sees the biggest gains in listings

Posted on June 12, 2018June 12, 2018 by The Tim

We know that inventory is growing in King County, but let’s look at broader Puget Sound area. Now that May is over, let’s update our “Around the Sound” statistics for King, Snohomish, Pierce, Kitsap, Thurston, Island, Skagit, and Whatcom counties.

The biggest gains in new listings and active inventory were in King County. Snohomish and Pierce also saw some decent increases, but further out it’s more of a mixed bag, with some counties still seeing declining listings and inventory.

Share:

  • Twitter
  • LinkedIn
  • Facebook
  • Reddit
  • Pinterest
  • Email

New listing absorption falls to a seven-year low

Posted on June 7, 2018 by The Tim

The big increase in listings is the first interesting development we’ve seen in the local real estate market in months, so here are a few alternative takes on recent home listing activity.

First up, here’s a chart of new listing absorption. This is a simple look at the ratio of pending sales to new listings. If more homes are going pending in a month than there are being listed, this ratio goes above 100 percent, which is obviously not great for buyers.

As of May, the absorption metric has dropped to 79 percent—its lowest level since June 2011. Interestingly, the rate was at its all-time highest level just last December at 162 percent. The absorption rate typically hits its lowest point of the year in June or July, so seeing it drop this low this fast is highly unusual.

Share:

  • Twitter
  • LinkedIn
  • Facebook
  • Reddit
  • Pinterest
  • Email

Posts navigation

  • Previous
  • 1
  • 2
  • 3
  • 4
  • 5
  • 6
  • 7
  • …
  • 46
  • Next

Tim’s Other Projects

Dispatches from the Multiverse

Tip Jar

Like what we're doing?

Drop us a tip!

Accounts

  • Log in
  • Entries feed
  • Comments feed
  • WordPress.org
©2024 Seattle Bubble | Built using WordPress and Responsive Blogily theme by Superb