Skip to content

Seattle Bubble

local real estate news, statistics, and commentary without the sales spin.

Menu
  • Home
  • About
  • Contact
  • Reference
  • Speaking
Menu

Tag: Statistics

March Stats Preview: Sales slip slightly from last March

Posted on April 2, 2018 by The Tim

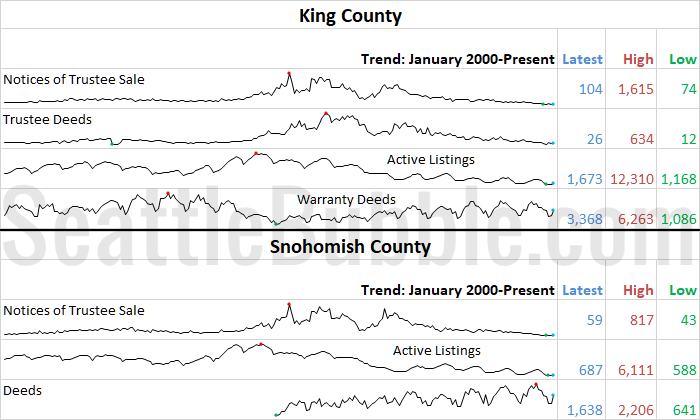
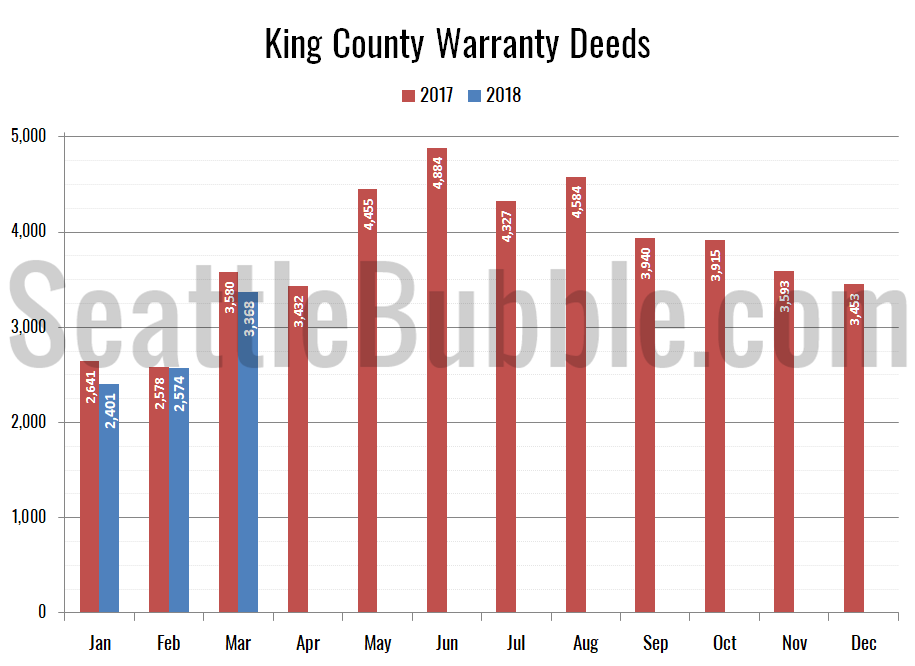
Now that March is done, let’s look at our regular monthly “preview” charts. Here’s the summary for March: Sales look to be a bit lower than last year, even as the spring bump has begun. Listings are still struggling to make gains. Foreclosures are still nearly non-existent.

Here’s the snapshot of all the data as far back as my historical information goes, with the latest, high, and low values highlighted for each series:

King & Snohomish County Stats Preview

If sales start falling off, we could see some hope for buyers later in 2018, but right now it’s too early to make a call like that…

Share:

  • Twitter
  • LinkedIn
  • Facebook
  • Reddit
  • Pinterest
  • Email

Case-Shiller Tiers: To. The. Moon.

Posted on March 28, 2018March 28, 2018 by The Tim

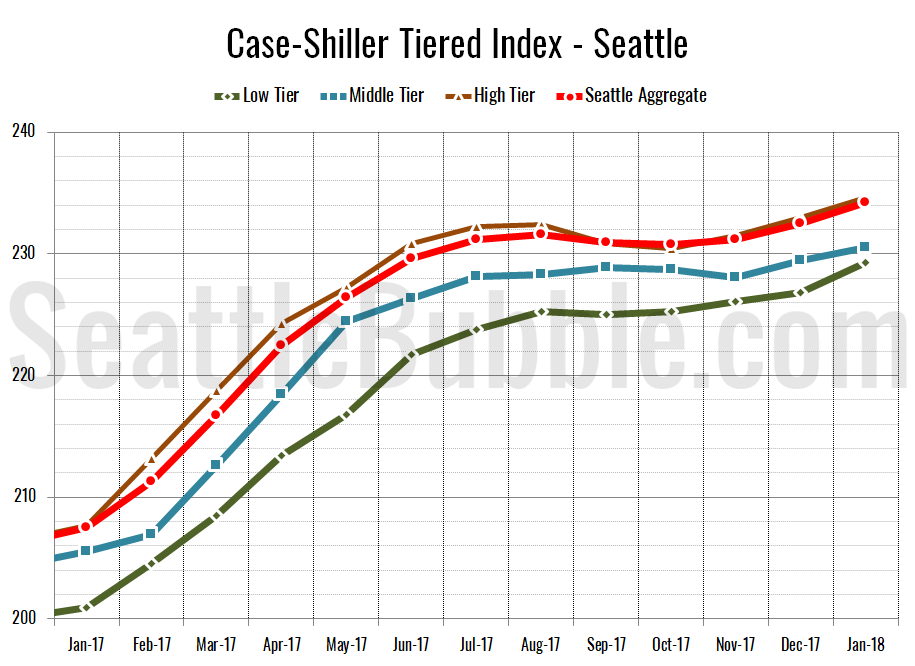
Let’s check out the three price tiers for the Seattle area, as measured by Case-Shiller. Remember, Case-Shiller’s “Seattle” data is based on single-family home repeat sales in King, Pierce, and Snohomish counties.

Note that the tiers are determined by sale volume. In other words, 1/3 of all sales fall into each tier. For more details on the tier methodologies, hit the full methodology pdf. Here are the current tier breakpoints:

  • Low Tier: < $373,070 (up 0.2%)
  • Mid Tier: $373,070 – $604,377
  • Hi Tier: > $604,377 (up 0.3%)

Share:

  • Twitter
  • LinkedIn
  • Facebook
  • Reddit
  • Pinterest
  • Email

Case-Shiller: Seattle kicks off 2018 with surging home prices

Posted on March 27, 2018March 28, 2018 by The Tim

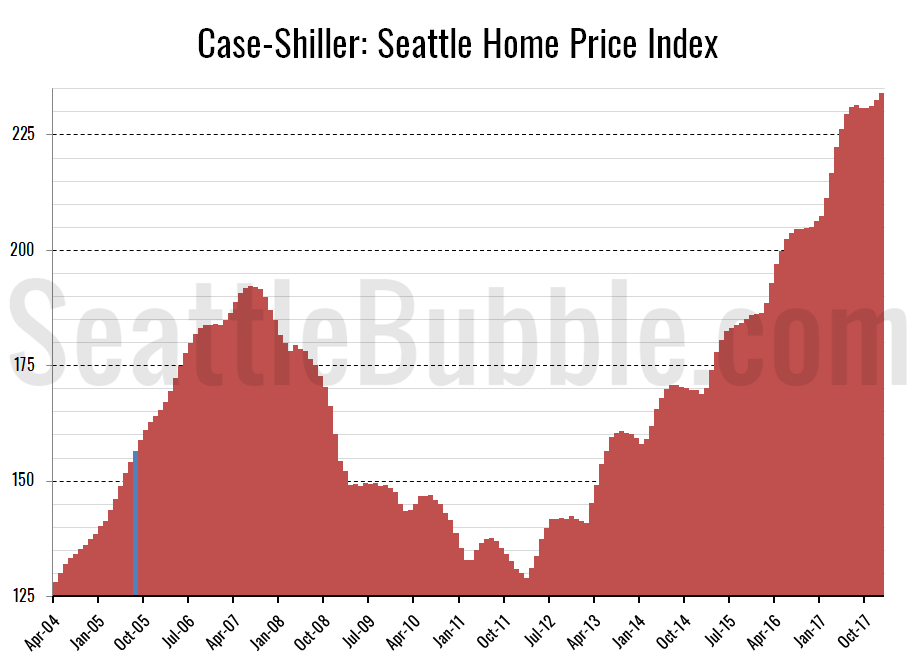
Let’s have a look at the latest data from the Case-Shiller Home Price Index. According to January data that was released this week, Seattle-area home prices were:

Up 0.7 percent December to January
Up 12.9 percent year-over-year.
Up 21.8 percent from the July 2007 peak

Over the same period last year prices were up 0.6 percent month-over-month and year-over-year prices were up 11.3 percent.

Seattle still leads the nation in year-over-year price growth. The only other metro areas with double-digit price growth from a year earlier are Las Vegas at 11.1 percent and San Francisco at 10.3 percent.

Share:

  • Twitter
  • LinkedIn
  • Facebook
  • Reddit
  • Pinterest
  • Email

Share of sales in cheap parts of King County hit all-time high as prices keep climbing

Posted on March 22, 2018 by The Tim

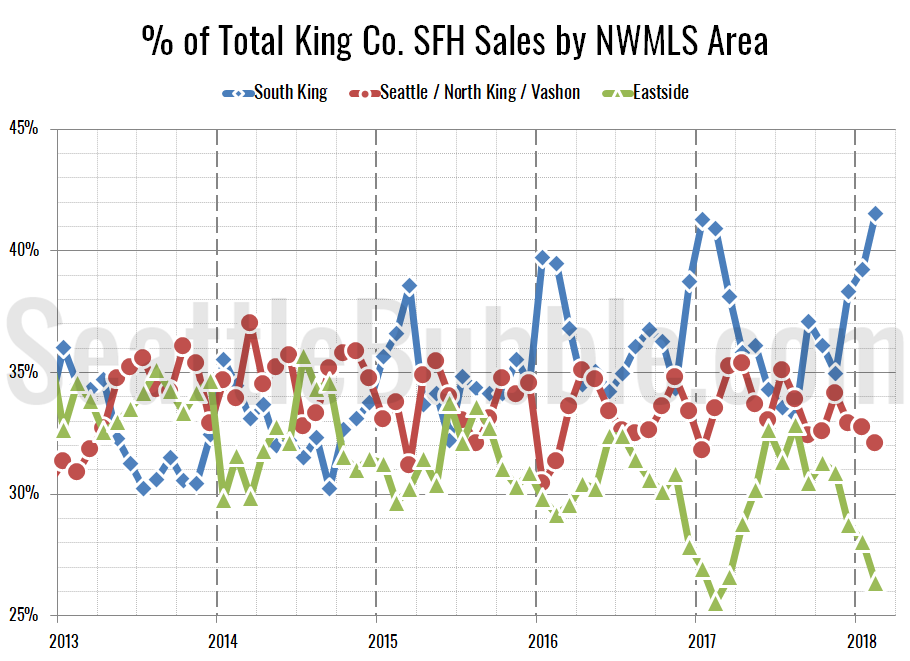
It’s been nearly a year since we took a look at the in-county breakdown data from the NWMLS to see how the sales mix shifted around the county. I like to keep an eye on this not only to see how individual neighborhoods are doing but also to see how the sales mix shift affects the overall county-wide median price.
…
The most interesting thing in this data is that in February the share of sales in the South King regions hit an all-time high at 41.6 percent, just edging out the previous high of 41.4 percent set in November 2007 (just four months after prices peaked). Despite this continued shift in sales toward the lower-priced regions, the county-wide median price continues to push upward.

Share:

  • Twitter
  • LinkedIn
  • Facebook
  • Reddit
  • Pinterest
  • Email

NWMLS: Closed sales plummet, listings still scarce

Posted on February 6, 2018 by The Tim

January market stats have been published by the NWMLS. Here’s a quick excerpt from their press release:

Home Buyers Still Competing for Sparse Inventory in Western Washington, Driving Up Prices – Especially for Sought-After Condominiums

“The Seattle area real estate market hasn’t skipped a beat with pent-up demand from buyers is stronger than ever,” remarked broker John Deely in reacting to the latest statistics from Northwest Multiple Listing Service. The report on January activity shows a slight year-over-year gain in pending sales, a double-digit increase in prices, and continued shortages of inventory.
…
“The decline in sales last month can’t be blamed on the holidays, weather or football. It’s simply due to the ongoing shortage of housing that continues to plague markets throughout Western Washington,” said OB Jacobi, the president of Windermere Real Estate.

Bummer for home salespeople that they can’t use the “football” excuse they usually throw out in January. Not that there’s really anything in these latest numbers for them to be concerned about.

Now let’s dive into the numbers for January…

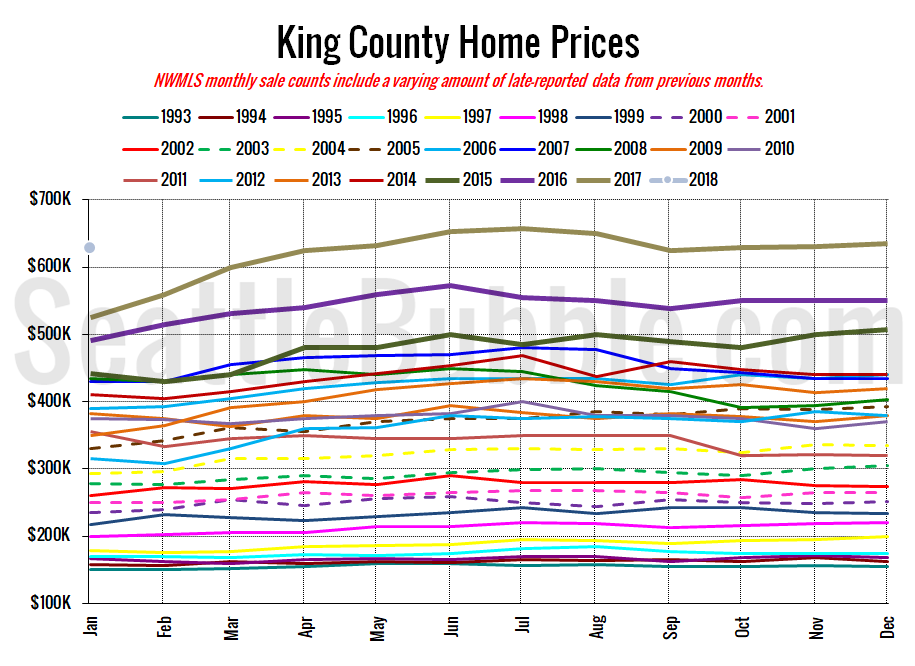
Inventory is at its lowest January level ever, and new listings were only barely above last year’s record-low level. Despite having nearly the same number of new listings as last year, closed sales and pending sales are both down considerably. Meanwhile, prices are up nearly twenty percent year-over-year.
Share:

  • Twitter
  • LinkedIn
  • Facebook
  • Reddit
  • Pinterest
  • Email

Posts navigation

  • Previous
  • 1
  • …
  • 8
  • 9
  • 10
  • 11
  • 12
  • 13
  • 14
  • …
  • 134
  • Next

Tim’s Other Projects

Dispatches from the Multiverse

Tip Jar

Like what we're doing?

Drop us a tip!

Accounts

  • Log in
  • Entries feed
  • Comments feed
  • WordPress.org
©2024 Seattle Bubble | Built using WordPress and Responsive Blogily theme by Superb