Just a quick note to let you know that I’m working on cleaning house here…
local real estate news, statistics, and commentary without the sales spin.
Just a quick note to let you know that I’m working on cleaning house here…
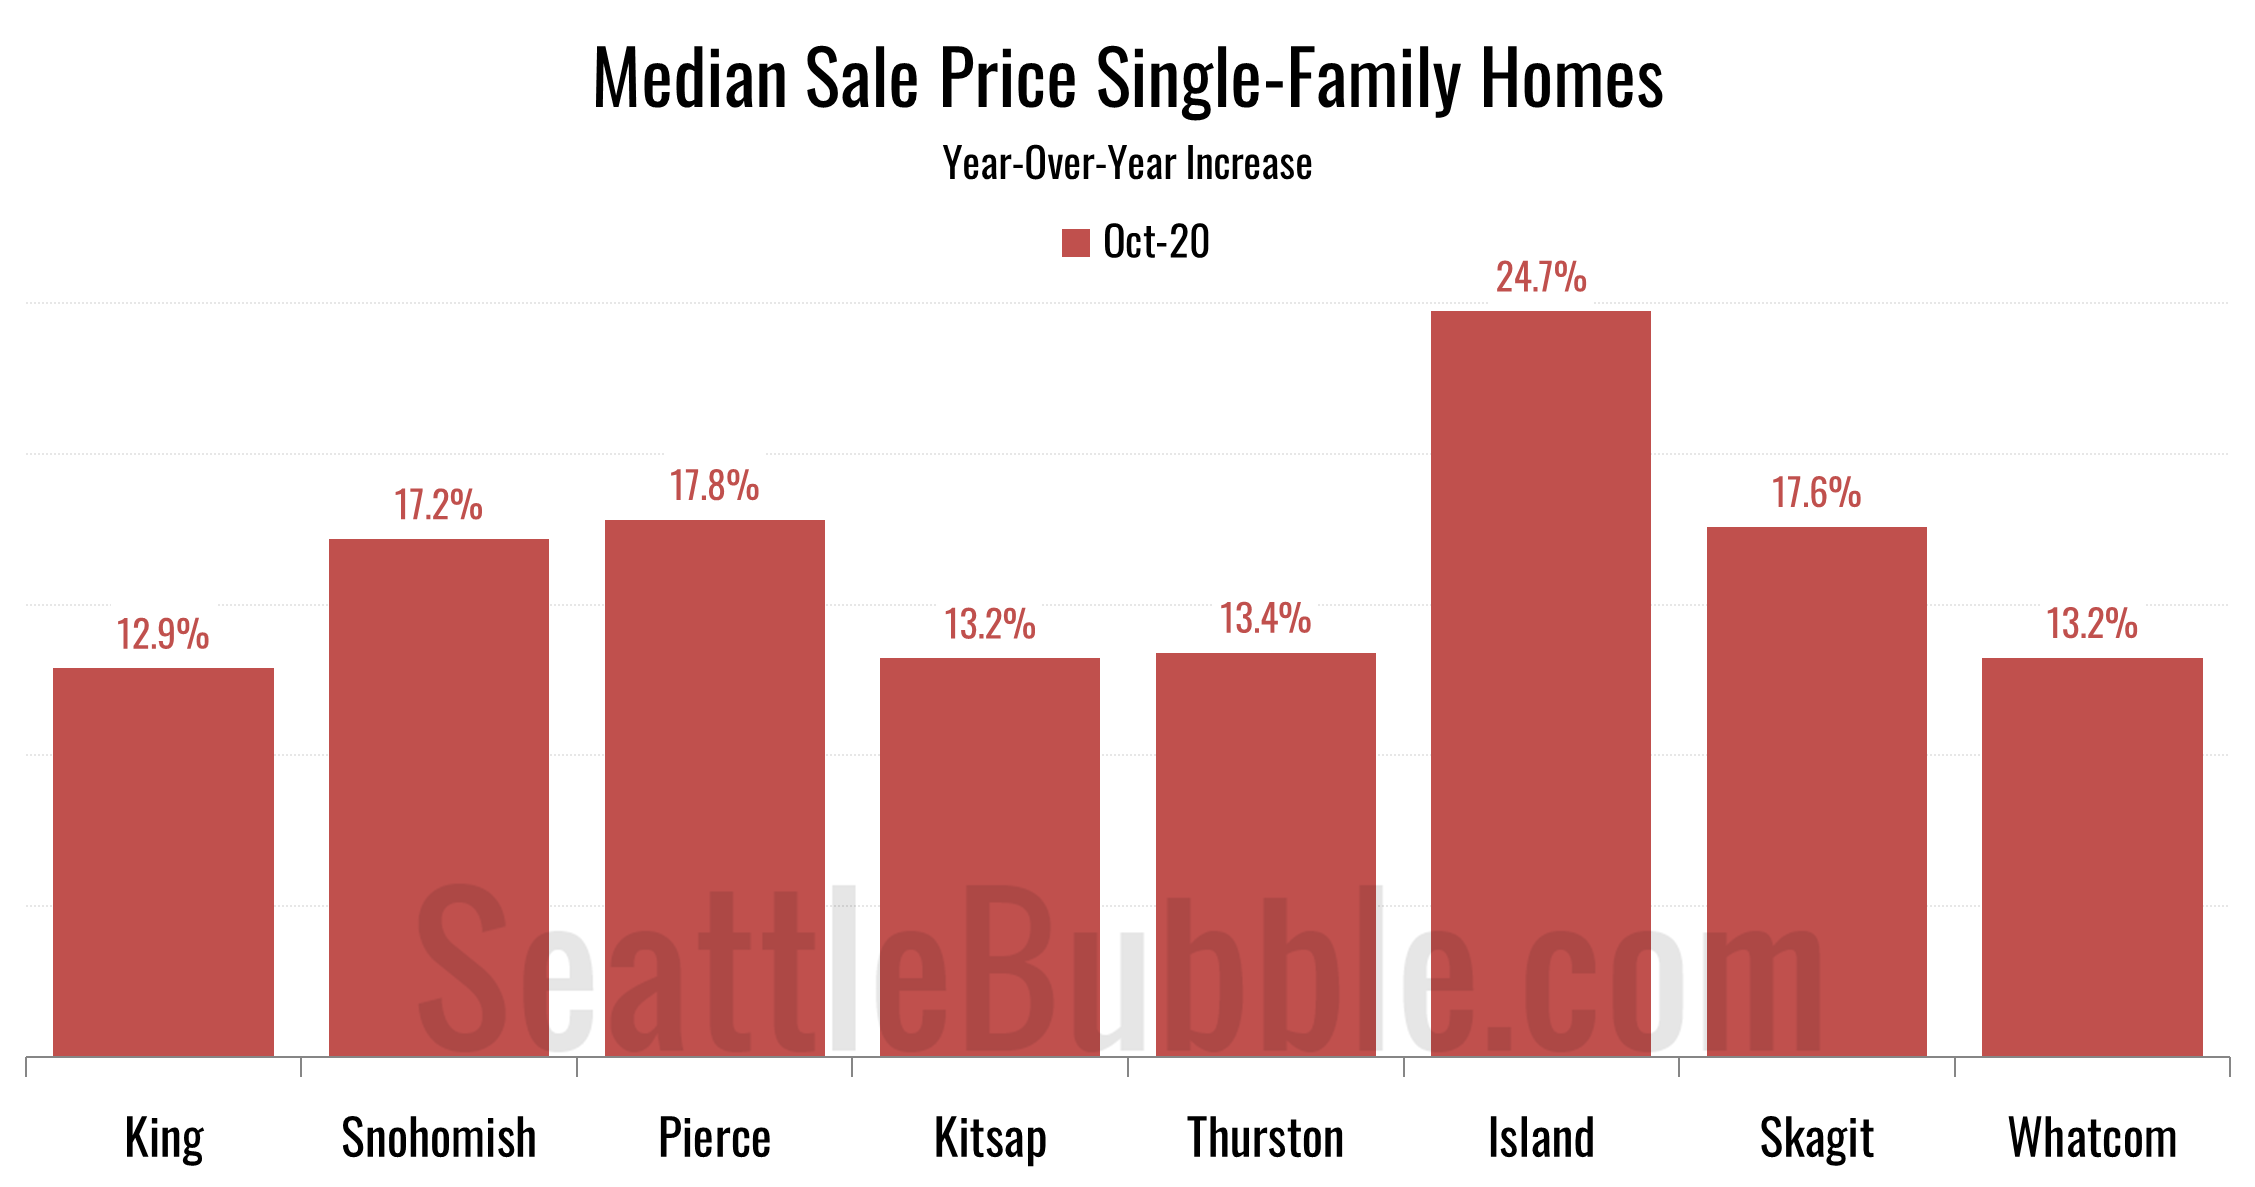
Let’s take a look at our stats for the local regions outside of the King/Snohomish core. Here’s your October update to our “Around the Sound” statistics for Pierce, Kitsap, Thurston, Island, Skagit, and Whatcom counties…
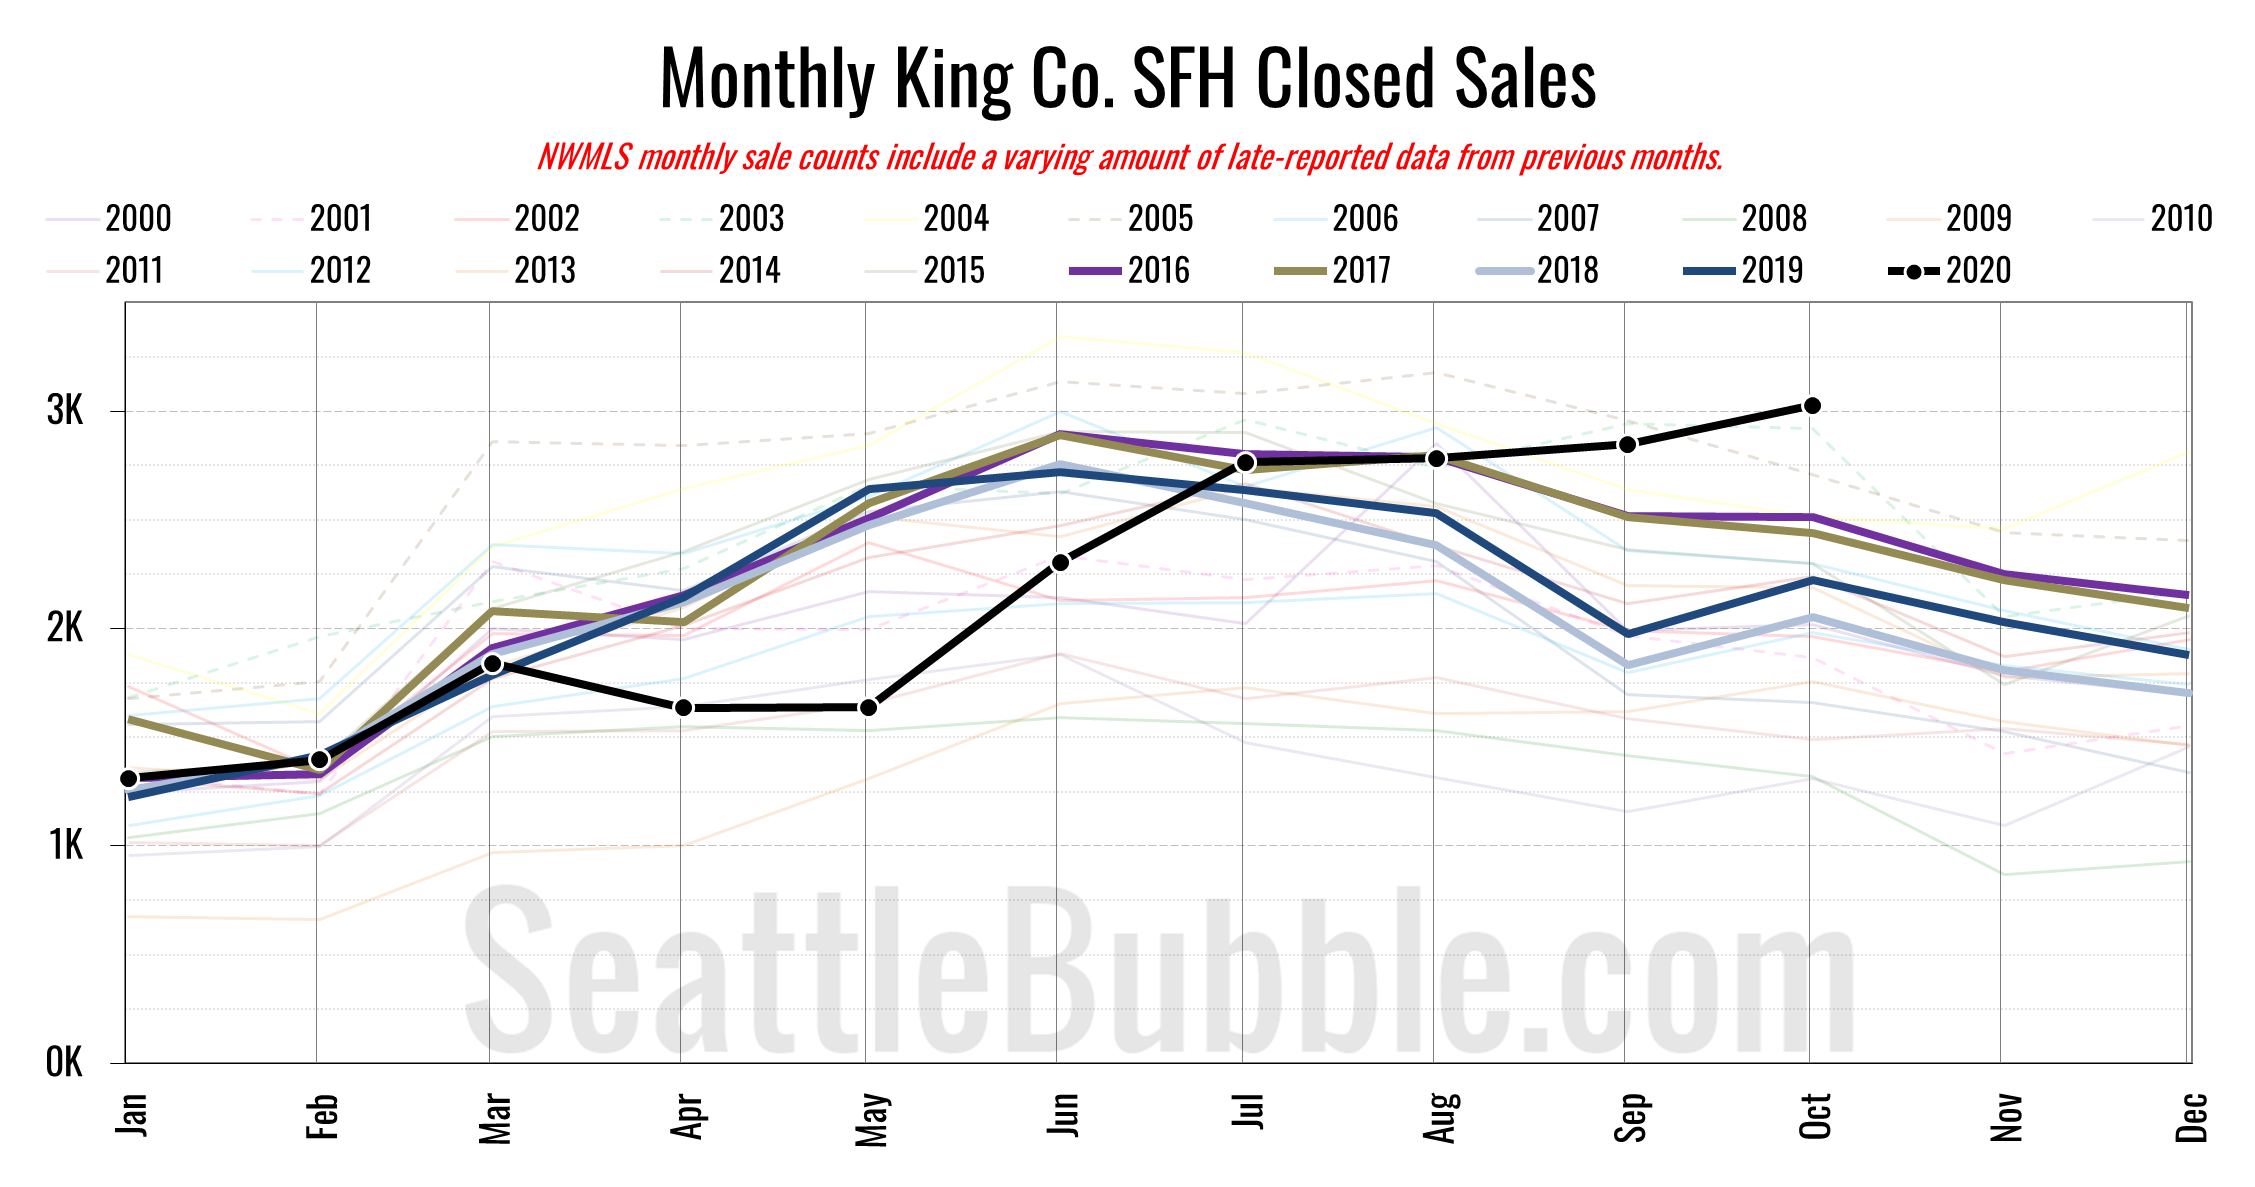
October market data from the NWMLS is available. Here’s what happened last month in the Seattle-area housing market: Home prices and pending sales fell slightly, but closed sales rose to the highest level ever seen during an October—over 3,000 sales.
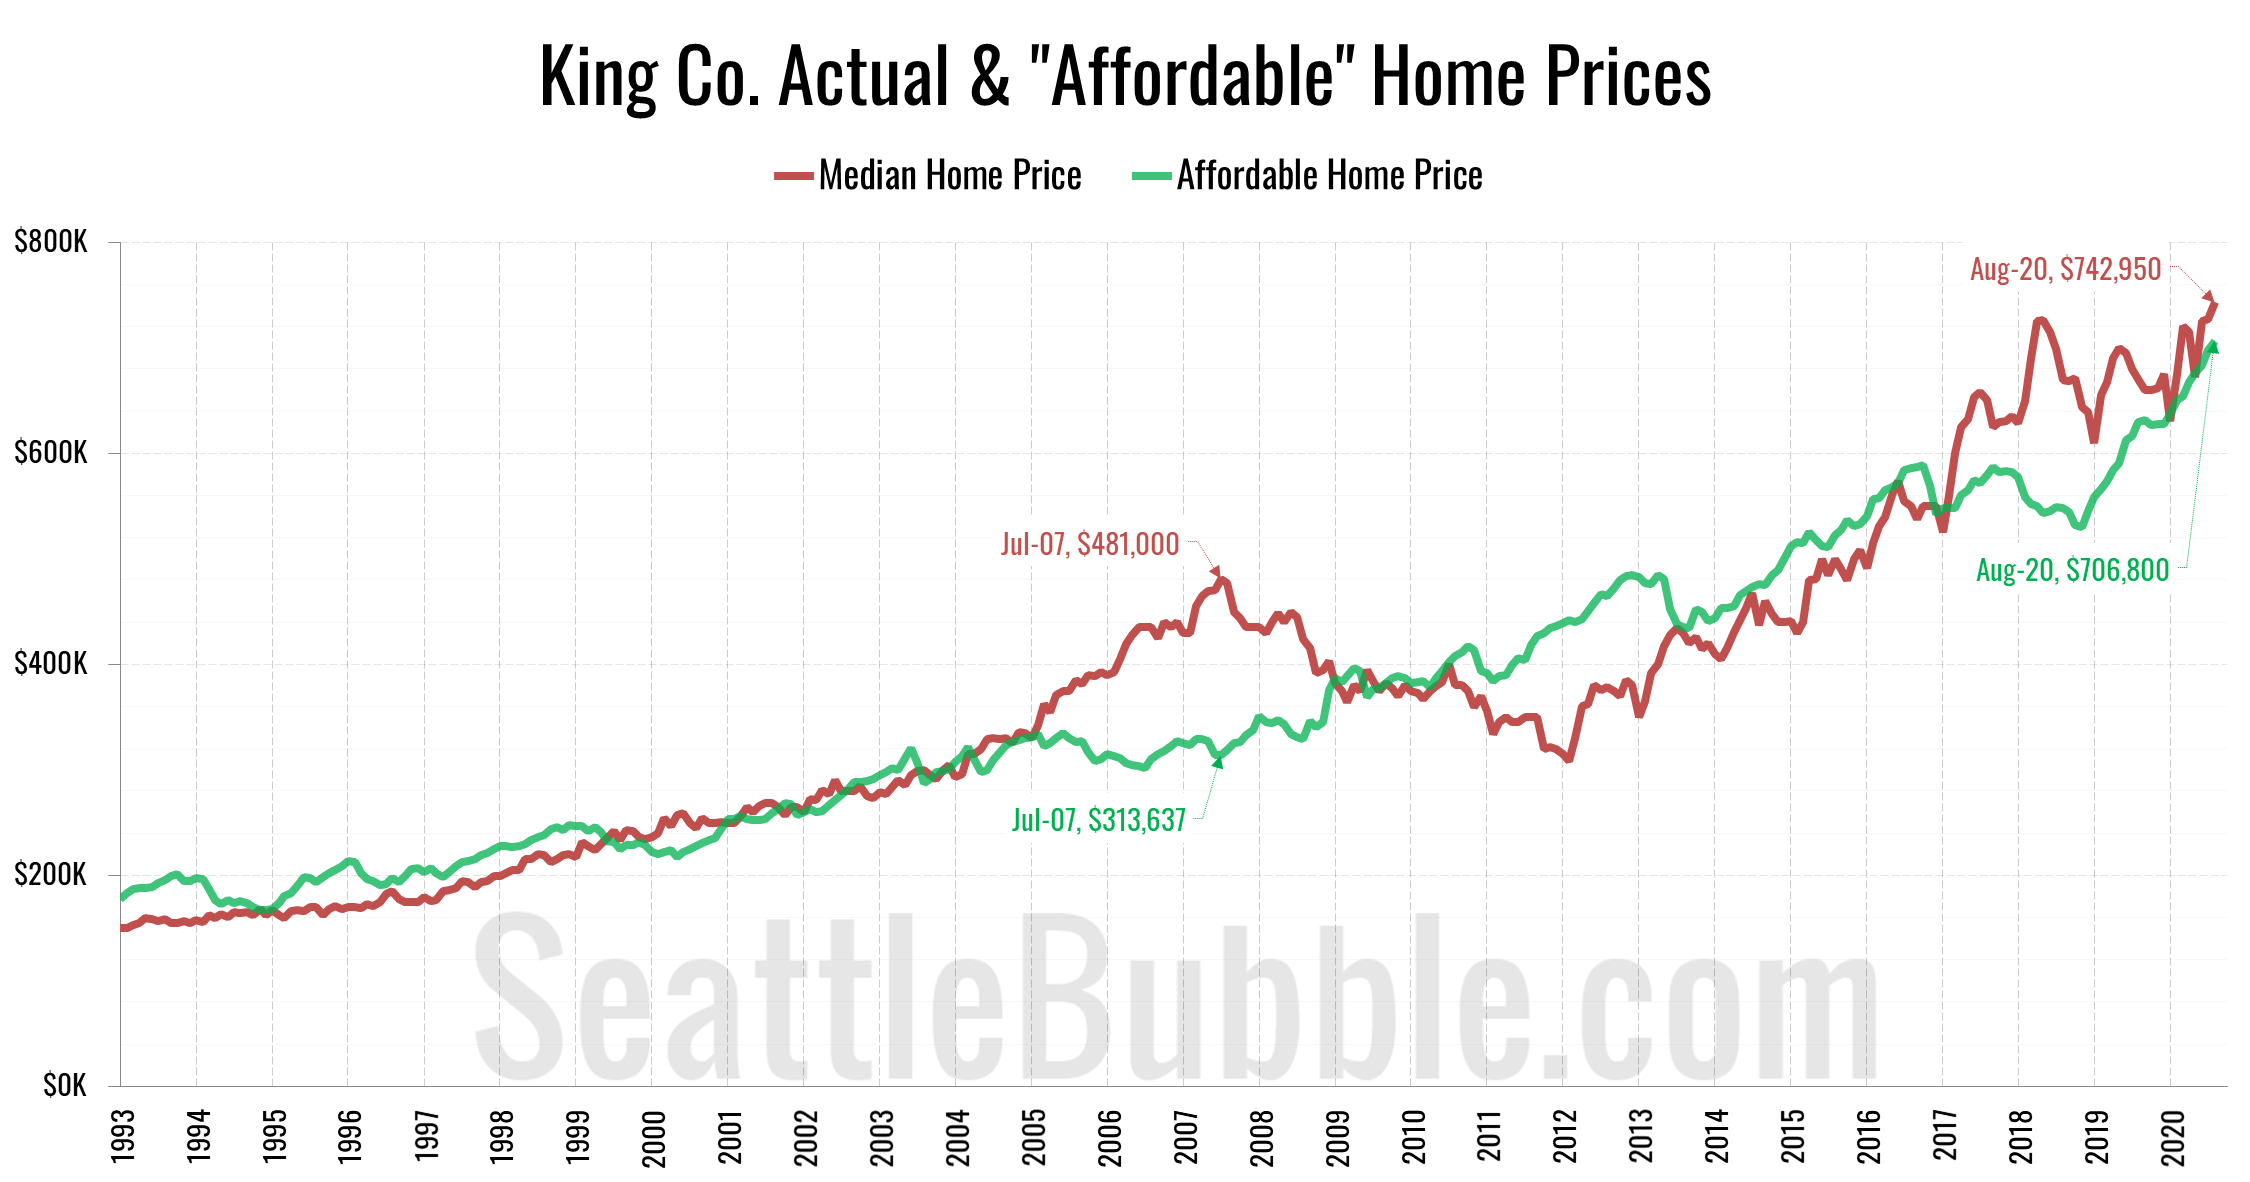
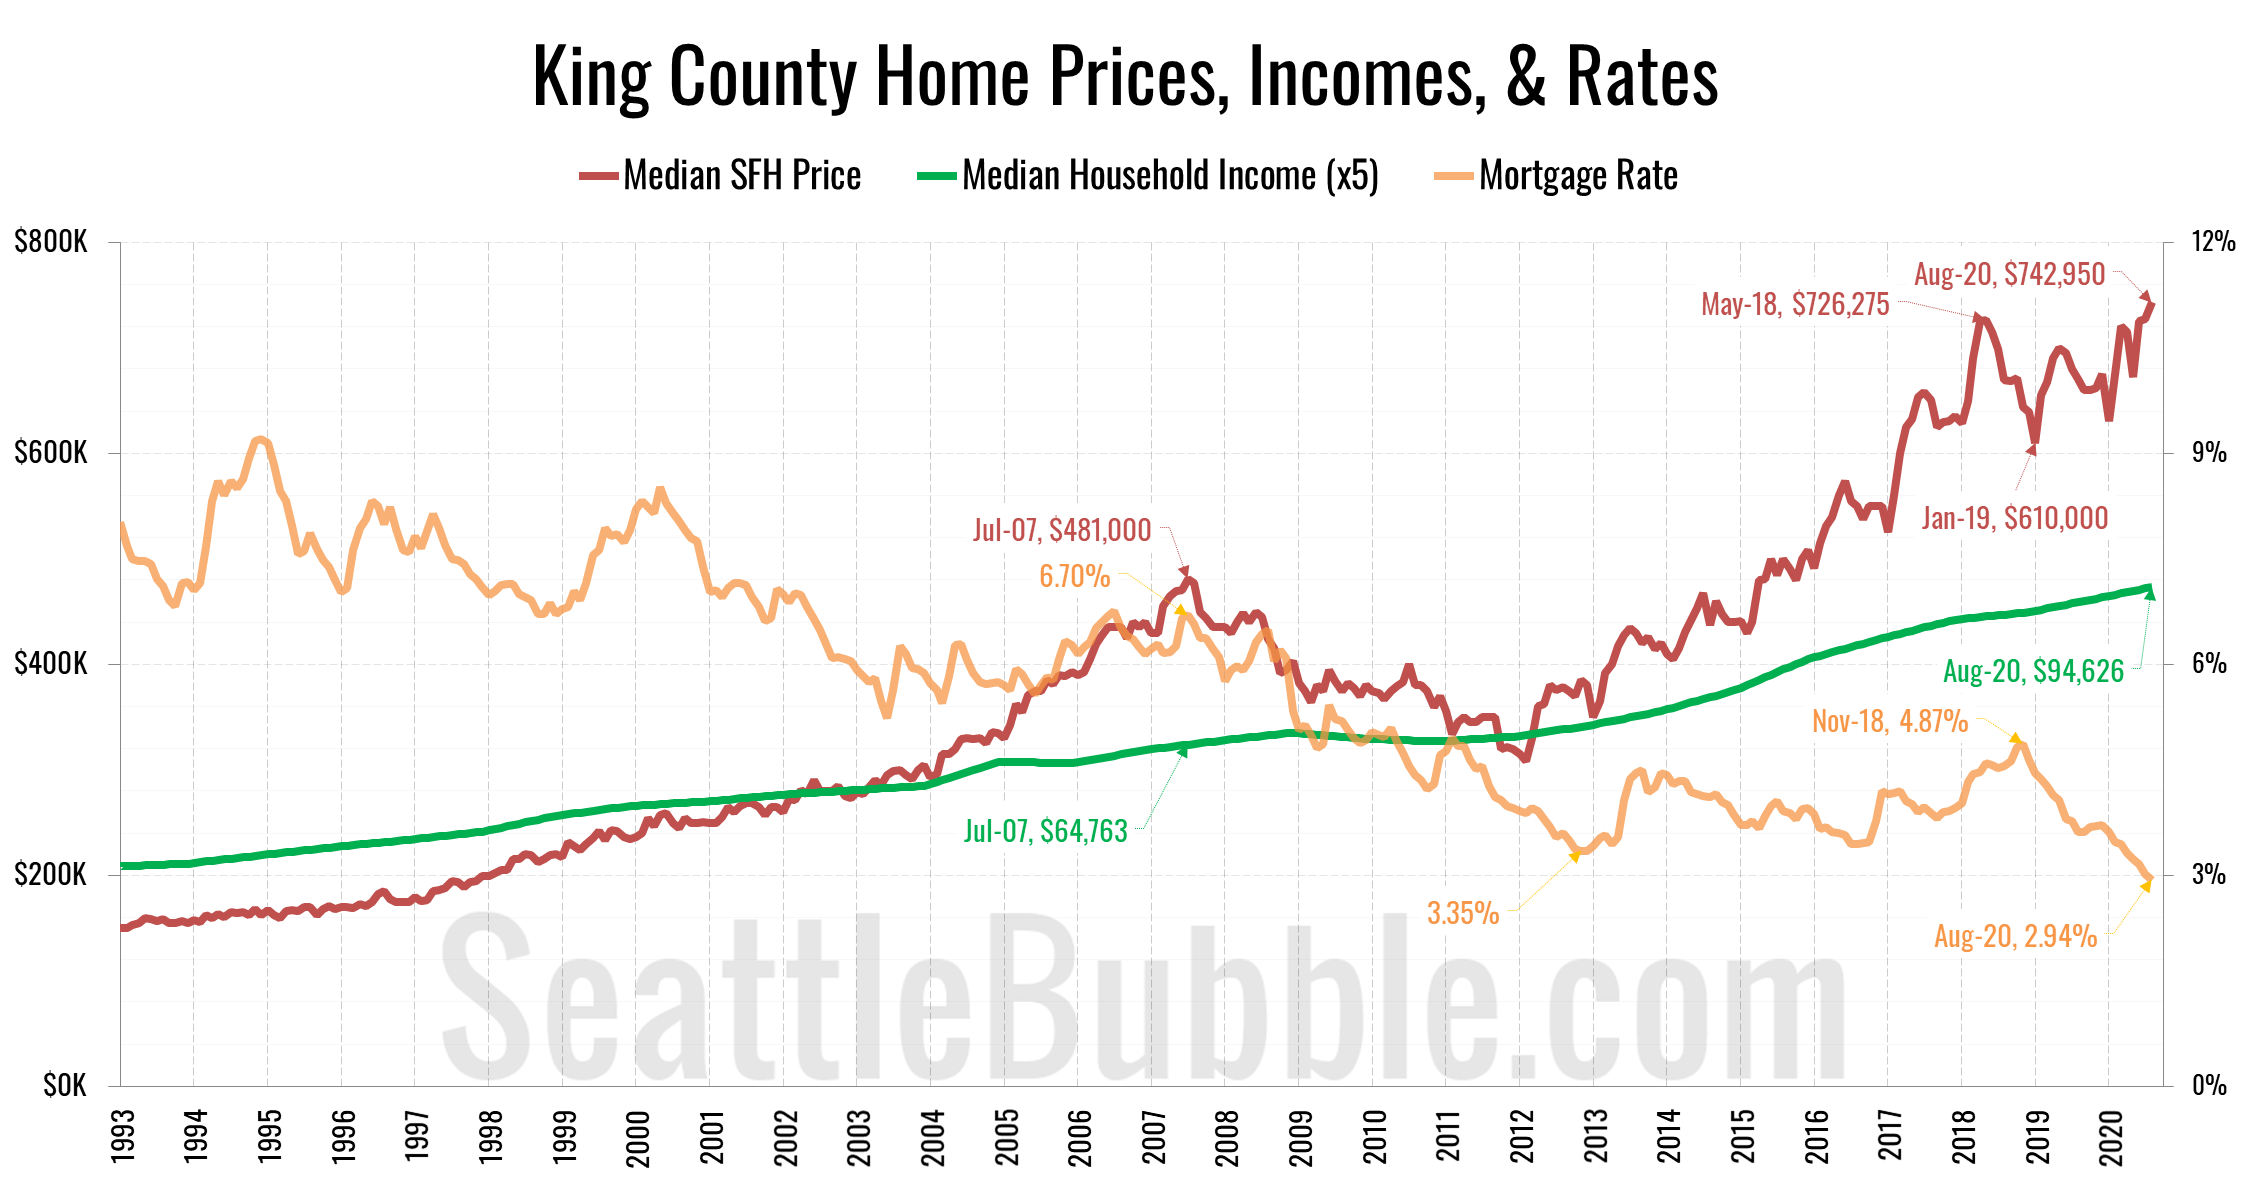
The “affordable” home price has shot up from $530,359 in November 2018 to an all-time high of $706,800 as of August. The current “affordable” home price in King County would have a monthly payment of $2,365…
It’s been quite a while since we’ve had a look at our affordability index charts for the counties around Puget Sound, so let’s have a look at those charts…