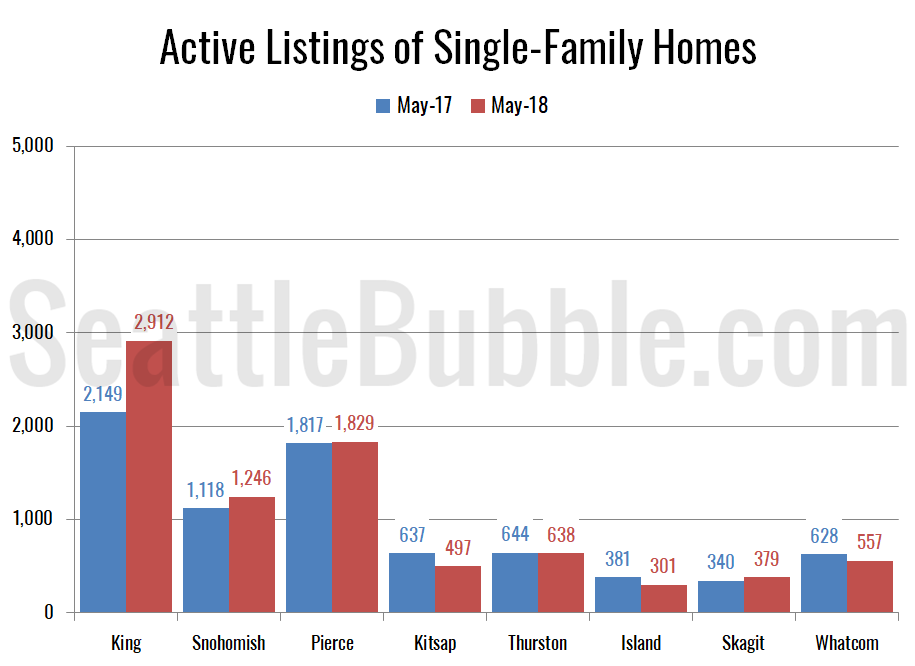
Seattle Bubble

News & discussion about real estate & the housing bubble in the Seattle area.

Seattle Bubble - News & discussion about real estate & the housing bubble in the Seattle area.

Entries Tagged as 'King_County'

Puget Sound Counties April NWMLS Update

Posted by The Tim on May 8th, 2008 at 12:19 PM · 58 Comments

Let’s check in on the NWMLS statistics from around the sound. I realized this month that if I’m going to include Skagit County in the Puget Sound wrapup, I should probably include Island County as well. So from now on we’re looking at seven Puget Sound counties. I’d change the name of the site to “PugetSoundBubble.com,” but I wouldn’t want to sacrifice the name recognition we’ve built up over the last few years. Anyway, here’s a little graphical look at what the market looks like around the sound.

Here’s where the YOY stats stand for each of the six counties as of April 2008:

King - Price: -3.6% | Listings: +49.4% | Sales: -27.8% | MOS: 6.2
Snohomish - Price: -6.7% | Listings: +27.7% | Sales: -42.9% | MOS: 7.9
Pierce - Price: -3.6% | Listings: +13.1% | Sales: -26.3% | MOS: 7.9
Kitsap - Price: -4.4% | Listings: +24.0% | Sales: -34.8% | MOS: 9.8
Thurston - Price: -2.7% | Listings: +0.9% | Sales: -17.1% | MOS: 5.9
Island - Price: -13.5% | Listings: +24.4% | Sales: -30.6% | MOS: 12.1
Skagit - Price: -6.5% | Listings: +20.8% | Sales: -31.7% | MOS: 9.3

Following below are the graphs you’ve come to expect. Click below to continue reading.

[Read more →]

Categories: Statistics
Tags: , , , , , , , , , ,

Puget Sound Counties March NWMLS Update

Posted by The Tim on April 18th, 2008 at 10:27 AM · 85 Comments

Here’s an update to the NWMLS statistics for all six Puget Sound counties. I don’t personally want to live in King County, and maybe you don’t either. So, here’s a little graphical look at what the market looks like around the sound.

Here’s where the YOY stats stand for each of the six counties as of March 2008:

King - Price: -3.3% | Listings: +56.6% | Sales: -36.9% | MOS: 6.2
Snohomish - Price: -7.8% | Listings: +35.9% | Sales: -43.6% | MOS: 7.7
Pierce - Price: -5.5% | Listings: +18.8% | Sales: -30.1% | MOS: 7.7
Kitsap - Price: -5.5% | Listings: +32.6% | Sales: -33.1% | MOS: 8.7
Thurston - Price: -1.7% | Listings: +9.9% | Sales: -20.6% | MOS: 5.7
Skagit - Price: +6.0% | Listings: +29.7% | Sales: -40.7% | MOS: 8.9

Following below are updates to the seven graphs I introduced with January’s data. Click below to continue reading.

[Read more →]

Categories: Statistics
Tags: , , , , , , , , , ,

Local Foreclosures Still on the Rise

Posted by The Tim on April 15th, 2008 at 10:03 AM · 47 Comments

Hmm, odd. The pace of foreclosures in the Seattle area seems to still be increasing.

The nationwide foreclosure surge continued in March, with the Seattle area following along at a lesser rate, according to a new report Monday.

The number of properties with foreclosure filings nationwide rose 57 percent in March from a year earlier and 5 percent from February, according to RealtyTrac, an Irvine, Calif., company that tracks foreclosures.

For King County, RealtyTrac reported 527 total foreclosure filings in March, up 31 percent from a year earlier and 7 percent from February.

The county had one filing for every 1,525 households, compared with one in every 528 households nationwide. The Seattle area, which RealtyTrac considers as King and Snohomish counties, had one filing per 1,423 households in February, putting it 167th out of 229 metropolitan areas; it was in 166th place in February and 173rd in January.

That’s still pretty far down on the list, which is to be expected since home price stagnation/deflation is only just getting started around here, and that seems to be what has really been driving foreclosures in other areas.

Meanwhile, foreclosures in Snohomish County were actually slightly lower than a year ago.

While foreclosures are rising in many areas of the country, the number of Snohomish County homeowners in jeopardy of losing their homes actually went down last month, according to RealtyTrac Inc.

In March, foreclosure filings were issued for 228 properties across the county. That translates a foreclosure rate of one out of every 1,187 households. That was down 3 percent from February and was 8 percent lower than the rate a year ago.

Unfortunately I have yet to locate any resource for historical foreclosure information, so we don’t have much to compare this with outside of these news reports.

(Aubrey Cohen, Seattle P-I, 04.15.2008)
(Eric Fetters, Everett Herald, 04.15.2008)

Categories: News
Tags: , , , , , ,

Puget Sound Counties February NWMLS Update

Posted by The Tim on March 18th, 2008 at 7:00 AM · 33 Comments

Here’s an update to the NWMLS statistics for all six Puget Sound counties. I don’t personally want to live in King County, and maybe you don’t either. So, here’s a little graphical look at what the market looks like around the sound.

Here’s where each of the six counties stand as of February 2008:

King - Price: -0.0% | Listings: +61.3% | Sales: -32.3% | MOS: 6.1
Snohomish - Price: -0.3% | Listings: +44.5% | Sales: -36.3% | MOS: 7.4
Pierce - Price: -7.4% | Listings: +26.0% | Sales: -28.2% | MOS: 8.6
Kitsap - Price: -12.3% | Listings: +35.5% | Sales: -35.2% | MOS: 9.7
Thurston - Price: +2.0% | Listings: +14.8% | Sales: -17.7% | MOS: 6.0
Skagit - Price: +9.2% | Listings: +23.2% | Sales: -20.6% | MOS: 8.4

Following below are updates to the seven graphs I introduced with January’s data earlier this month. Click below to continue reading.

[Read more →]

Categories: Statistics
Tags: , , , , , , , , , ,

Strong Local Economy Faltering, County Facing Large Deficit

Posted by The Tim on March 12th, 2008 at 9:28 AM · 51 Comments

If you think our “strong local economy” is going to protect the Seattle area from feeling a pinch in the housing market and elsewhere as recession looms on the horizon, think again. The pinch is here.

Photo by Flickr user sweet_chicago1With a cooling economy pinching tax revenue even as government costs rise, King County faces a $45 million budget deficit in 2009 unless services are cut below current levels, county officials said Tuesday.

That projection is gloomier than the $25 million general fund shortfall for 2009 forecast by County Executive Ron Sims in October. And the years beyond 2009 look worse still, county Budget Director Bob Cowan said.

The general fund relies primarily on sales and property taxes. The recent rapid growth in sales tax revenue is slowing with the economy. Property tax growth also is faltering: Although overall tax increases on existing property are capped at 1 percent in any event, new construction is exempt from that limit, and the housing slowdown has put a crimp in that revenue source, Cowan said.

So much for our special immunity. But as long as Microsoft and Boeing keep hiring, everything will work out, right?

How about instead of sticking our heads in the sand and pretending everything will just be okay, we get in gear and start looking for ways to work through the hard times that are almost certain to be just around the corner?

Along those lines, I received an email from a reader that wanted to discuss “where people should spend their tax rebate checks in a way that will truly benefit our economy.” Personally I think the problems with our economy are beyond the point where putting a few thousand dollars in everybody’s pocket is going to help things. I’d suggest using the money to pay off a little debt, do a little contrarian investing, or just plain save it… pretty much anything but spending it.

Anyway, how do you think individuals, families, and local governments can best prepare for a serious economic slowdown?

(Gregory Roberts, Seattle P-I, 03.11.2008)

Categories: News
Tags: , , ,

NWMLS Statistics from Around the Sound

Posted by The Tim on March 5th, 2008 at 12:00 PM · 13 Comments

A number of readers have pointed out that despite what Seattle residents may think, there is in fact a world outside of King County. These inquiring readers are interested in seeing what the stats we discuss on Seattle Bubble look like for other local counties around the Puget Sound. Well, this post is for you. Following is a graphical look at the NWMLS data on prices, listings, and pending sales from January 2000 through January 2008 for King, Snohomish, Pierce, Kitsap, Thurston, and Skagit counties. It doesn’t get much more Puget Sound than this.

This post has a total of seven different graphs, so click below to continue reading.

[Read more →]

Categories: Statistics
Tags: , , , , , , , , , ,