Get access to the full spreadsheets used to make the charts in this and other posts, as well as a variety of additional insider benefits by becoming a member of Seattle Bubble.
August market stats were published by the NWMLS on Friday before the holiday weekend. The King County median price of single-family homes rose over 10 percent year-over-year for the first time since May of 2018. Inventory is way down from a year ago, and pending sales climbed to an all-time record high.
Recession? What recession?
Before we get into our detailed monthly stats, here’s a quick look at their press release.
Would-be homebuyers have more buying power, but also more competition for meager inventory
“In order for buyers to be successful in purchasing a home in today’s climate, they have to do some pretty illogical things,” remarked Wilson, the Kitsap regional manager and branch managing broker at John L. Scott Real Estate in Poulsbo. As examples, he listed waiving inspections, paying more than the house is worth, or agreeing to pay the difference in cash between the lower appraised value and the sales price. “These are counterintuitive to what we used to see with a negotiation process,” he lamented.“The lowest number of homes for sale in more than 20 years combined with the lowest mortgage rates on record are resulting in the perfect storm of frustration for buyers – but they are still out in force,” stated Windermere Chief Economist Matthew Gardner. “The few homes that are on the market are being snapped up quickly, and this excess of demand is causing record-high prices for single family homes in the Puget Sound area.” He also noted rising demand for lower density housing in outer suburbs.
I still find it quite amusing that Matthew Gardner is now the Chief Economist at Windermere.
NWMLS monthly reports include an undisclosed and varying number of
sales from previous months in their pending and closed sales statistics.
Here’s your King County SFH summary, with the arrows to show whether the year-over-year direction of each indicator is favorable or unfavorable news for buyers and sellers (green = favorable, red = unfavorable):
| August 2020 | Number | MOM | YOY | Buyers | Sellers |
|---|---|---|---|---|---|
| Active Listings | 2,590 | -1.7% | -38.2% |  |
 |
| Closed Sales | 2,783 | +0.7% | +10.0% |  |
 |
| SAAS (?) | 1.36 | -1.2% | +23.2% |  |
 |
| Pending Sales | 3,537 | +3.1% | +34.8% |  |
 |
| Months of Supply | 0.93 | -2.3% | -43.8% |  |
 |
| Median Price* | $742,950 | +2.1% | +10.9% |  |
 |
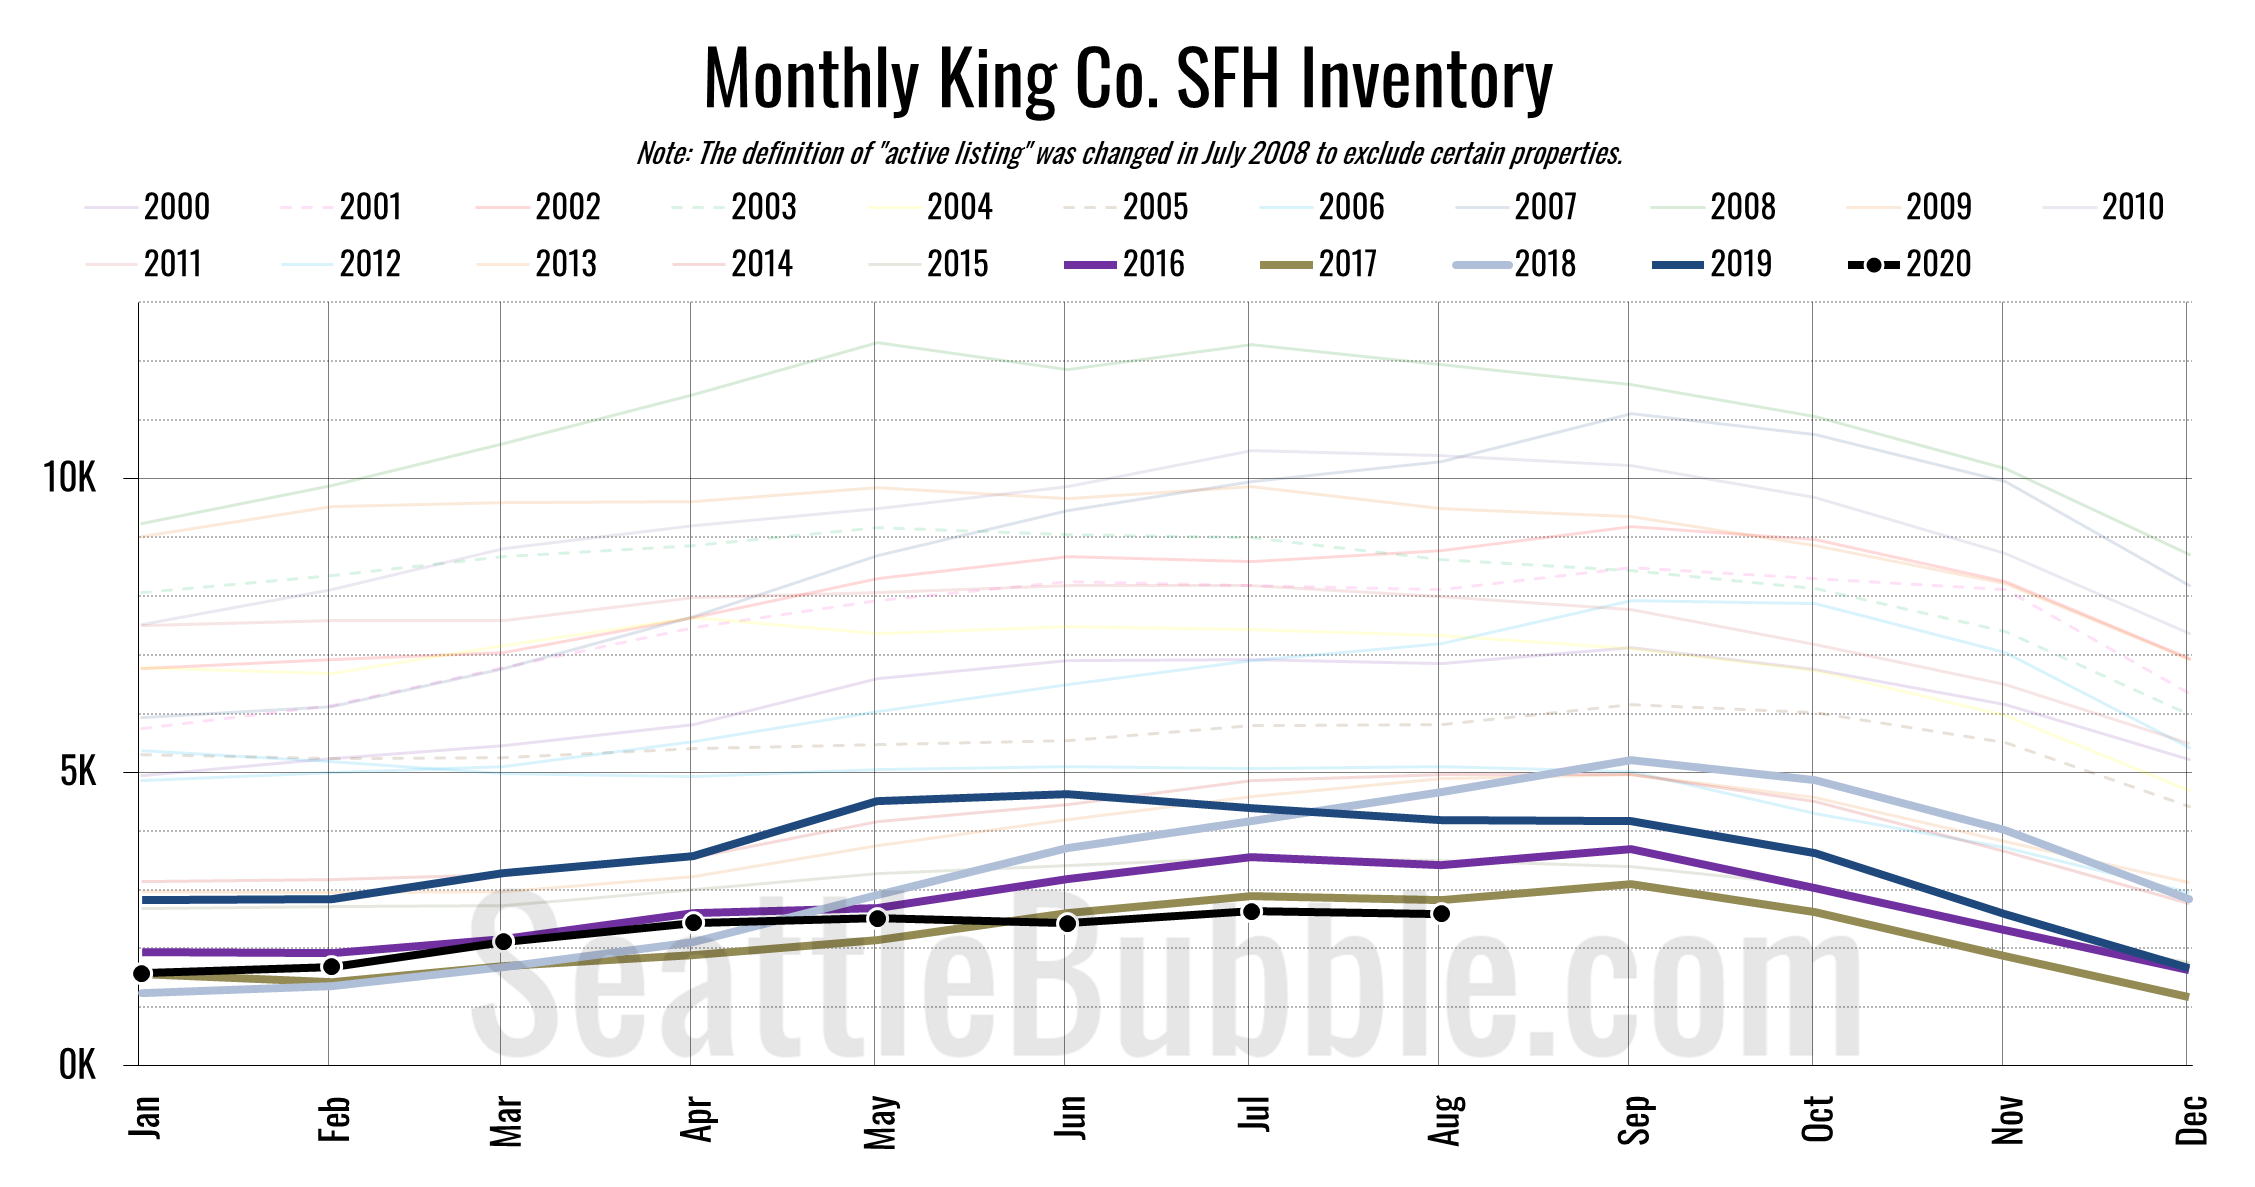
Here’s the graph of inventory with each year overlaid on the same chart.
Inventory fell 1.7 percent from July to August, and was down 38 percent from last year. We’re not currently at an all-time low for the number of homes on the market, but this winter is shaping up to hit a new low unless something changes dramatically.
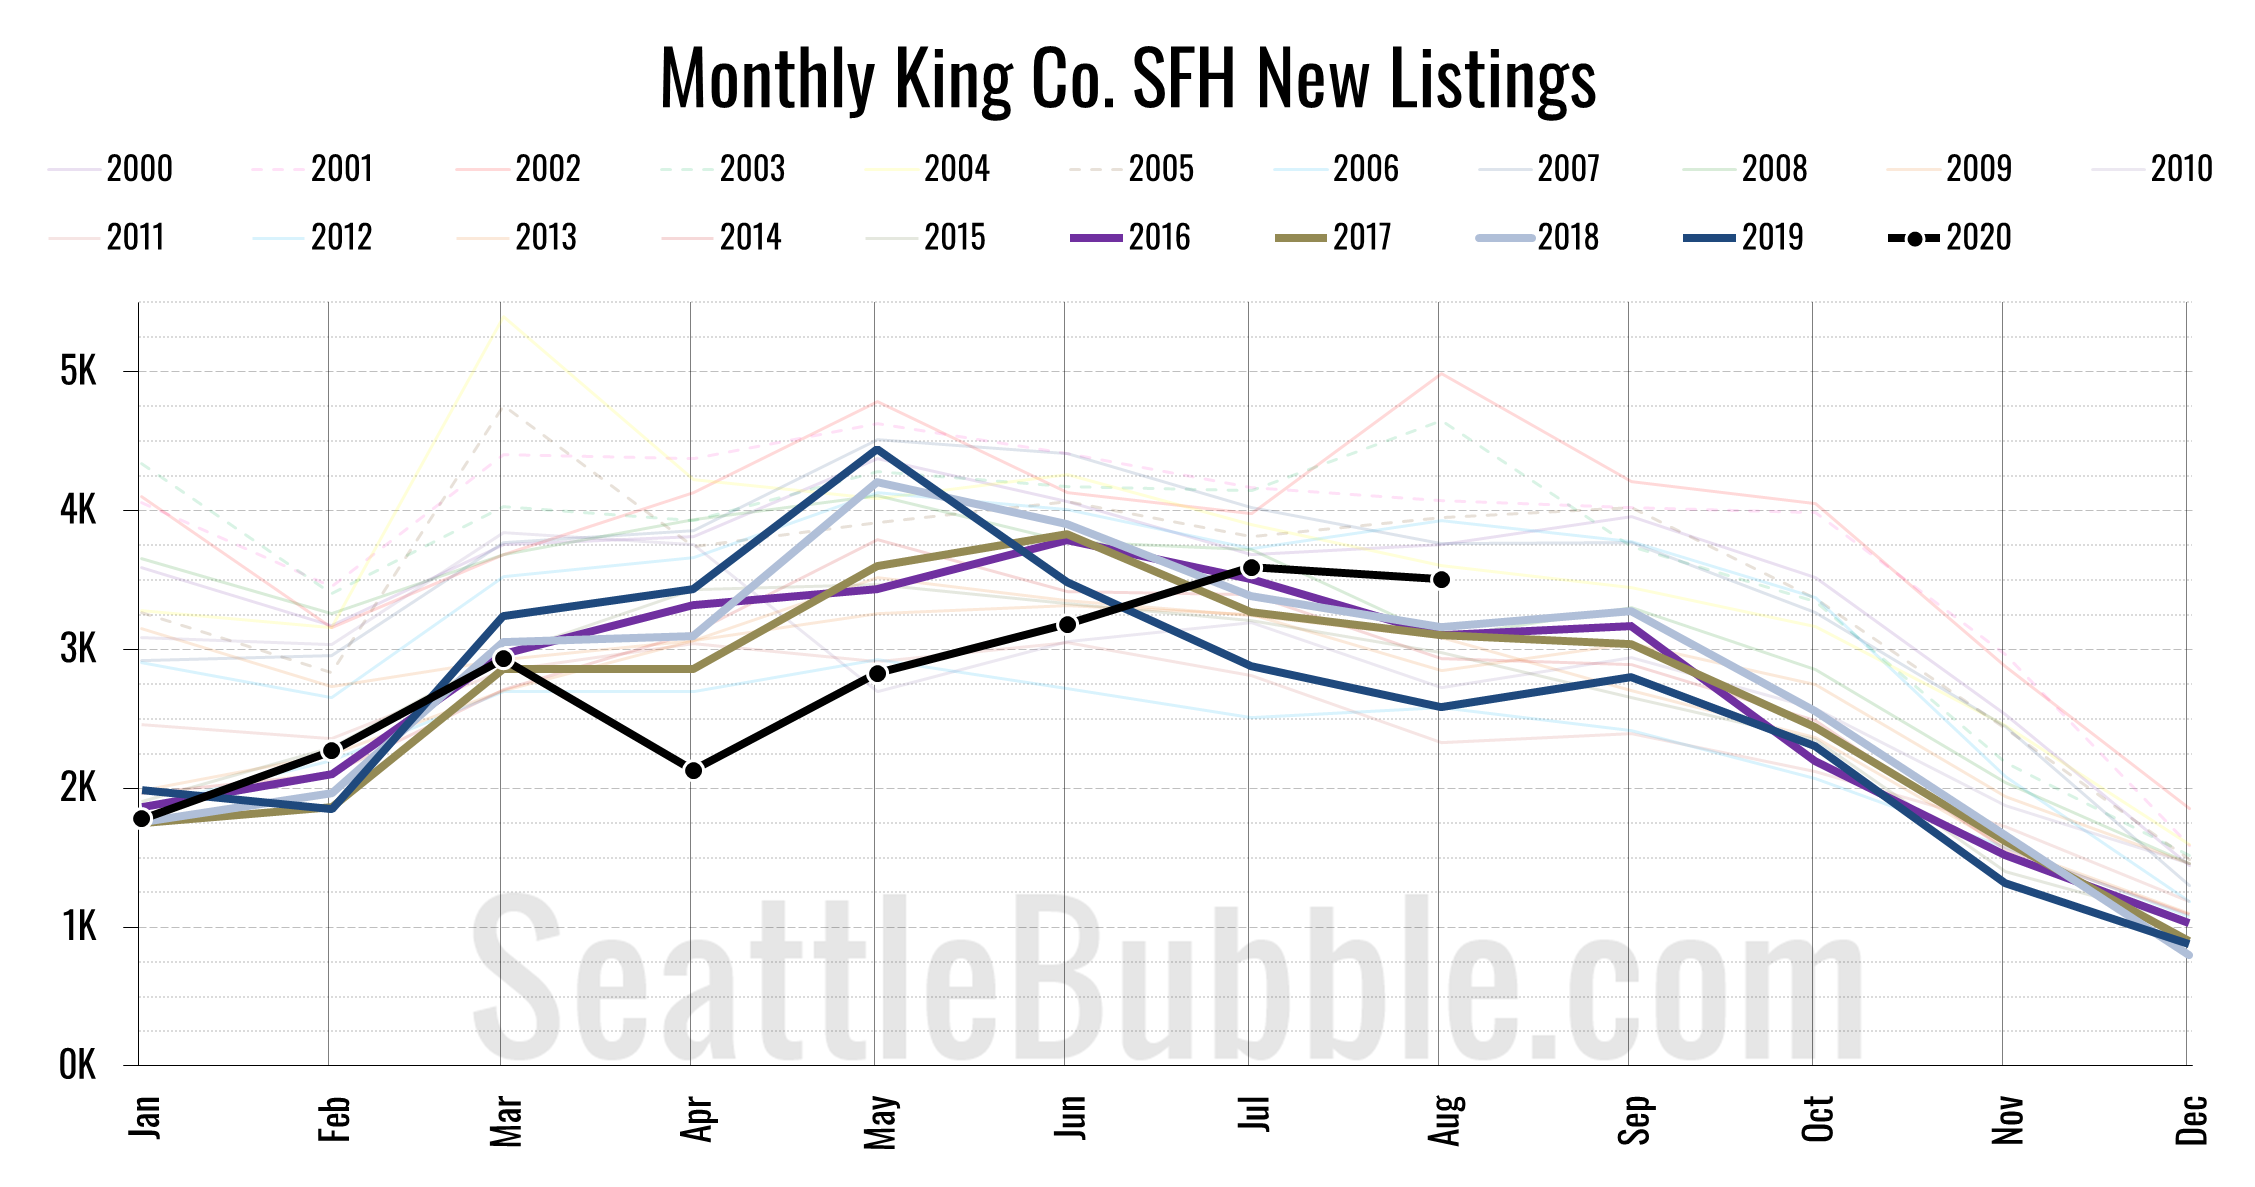
Here’s the chart of new listings:
The good news is that new listings were up 35 percent from a year ago, and did not decline nearly as much between July and August as we see in a typical year.
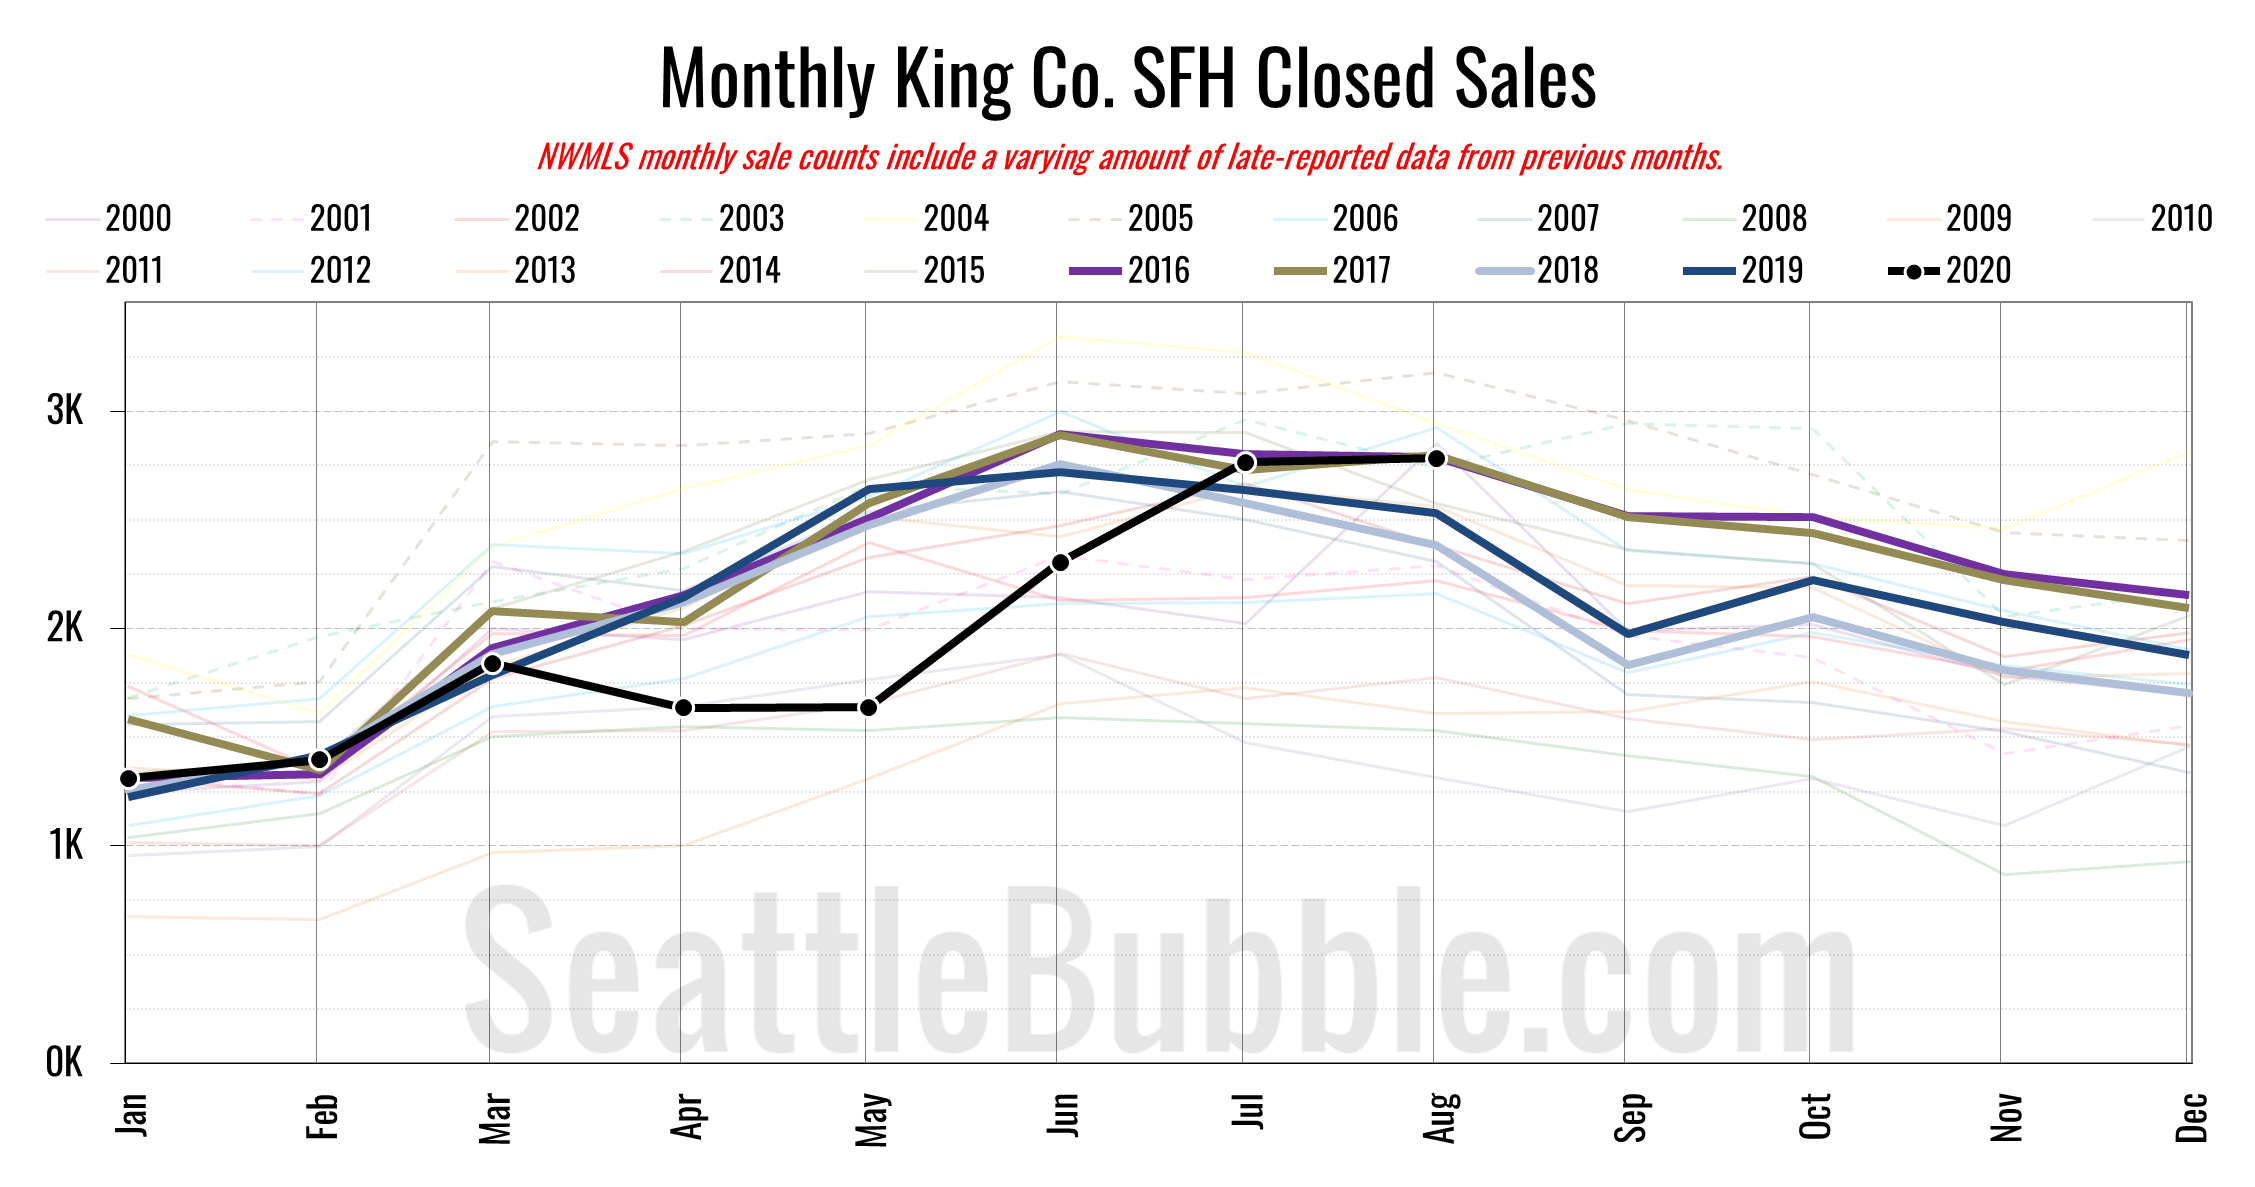
Here’s your closed sales yearly comparison chart:
Closed sales were basically flat between July and August. Last year over the same period closed sales fell 4 percent. Year-over-year closed sales were up 10 percent.
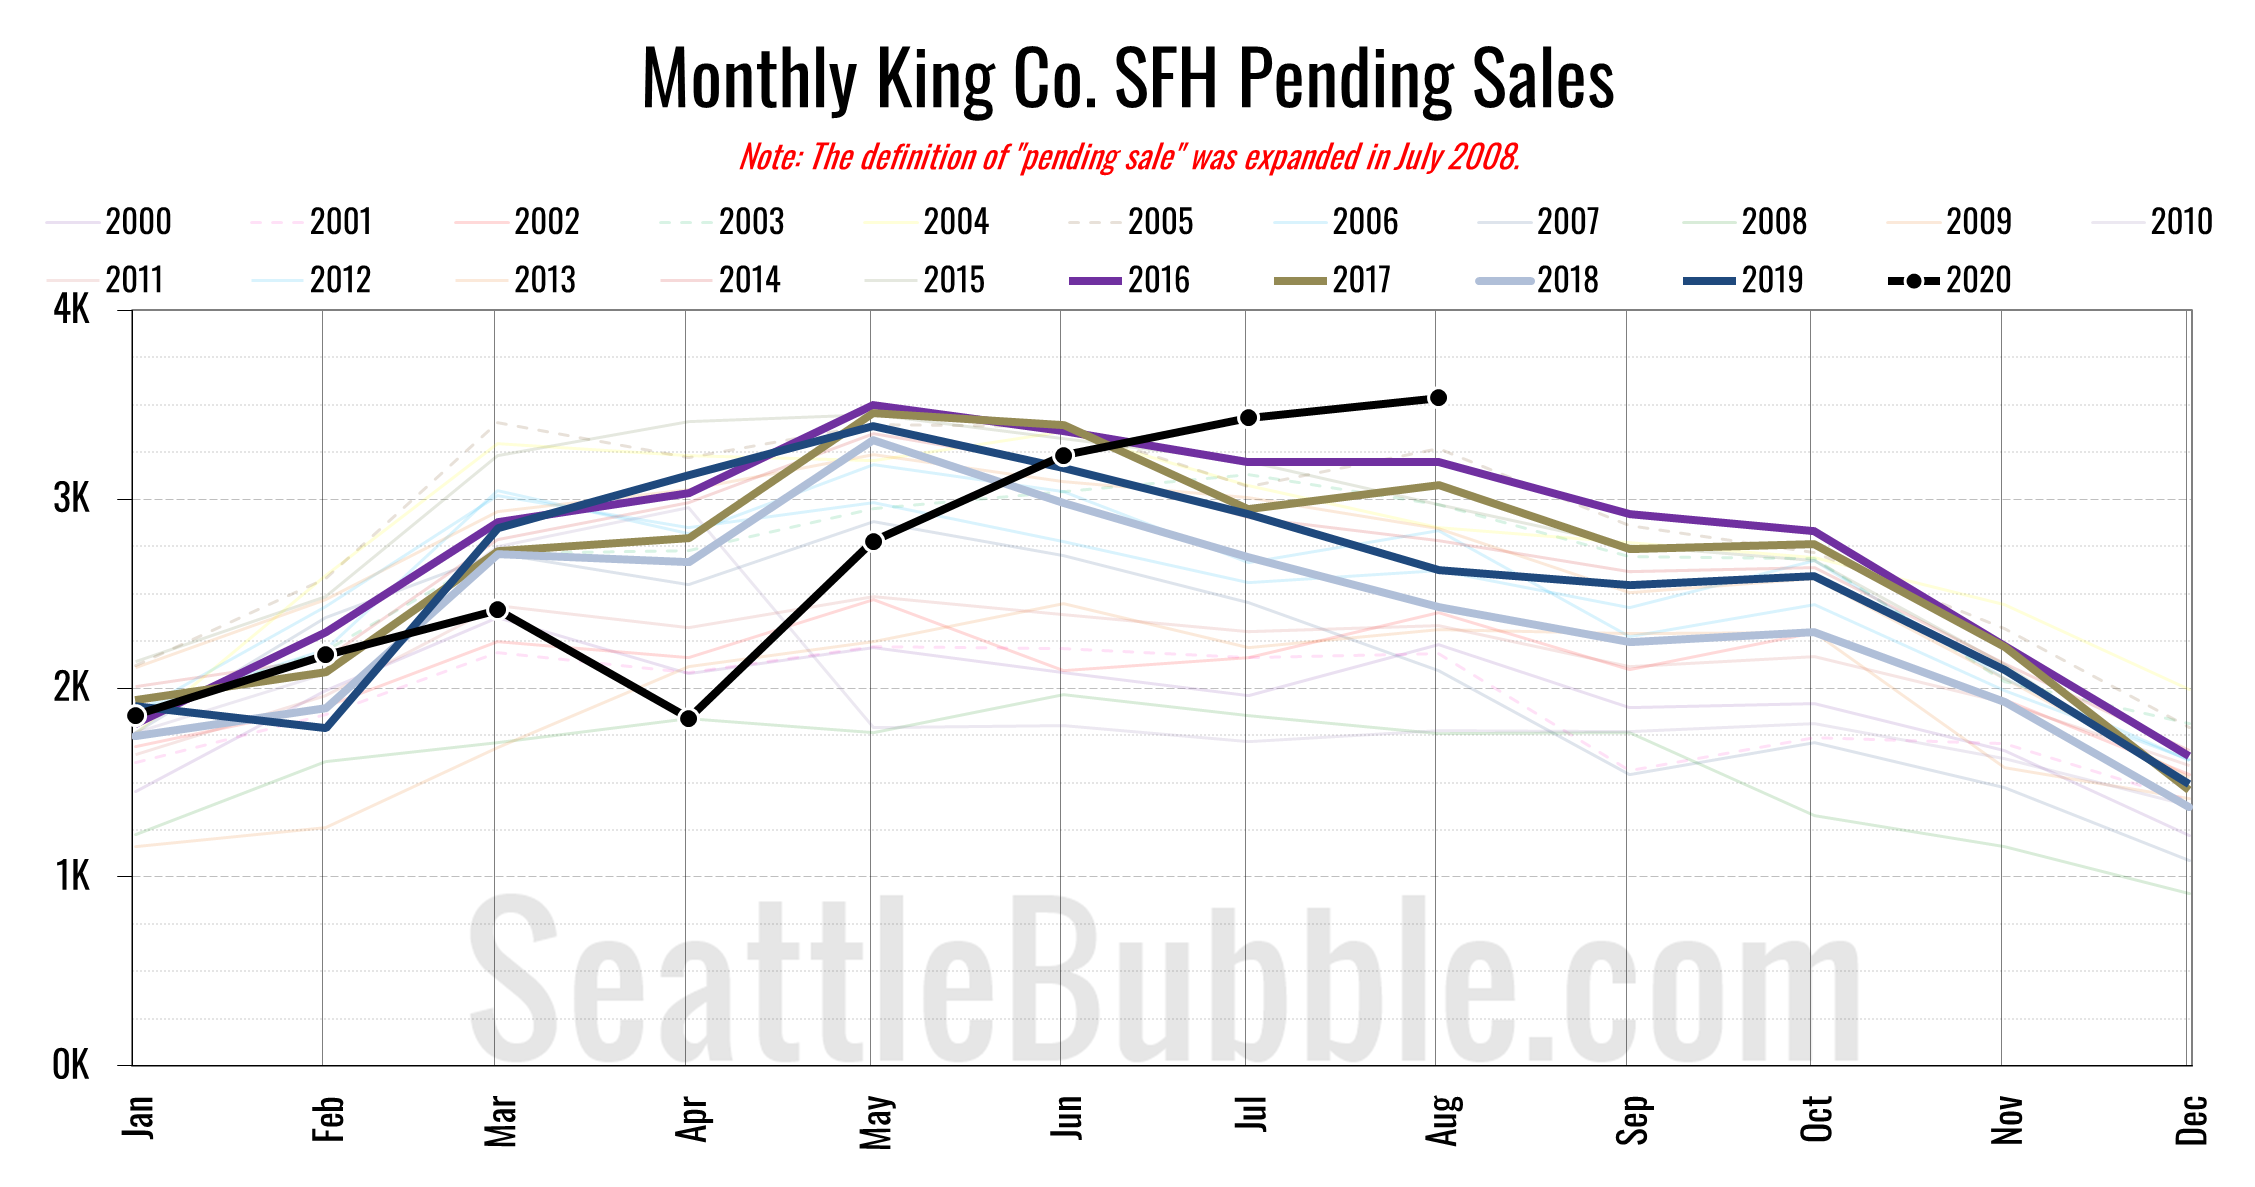
Pending sales rose 3 percent from July to August, and were up 35 percent year-over-year. No month on record going all the way back through 2000 has seen more pending sales than we saw in August. For Seattle-area homebuyers, the recession is apparently non-existent.
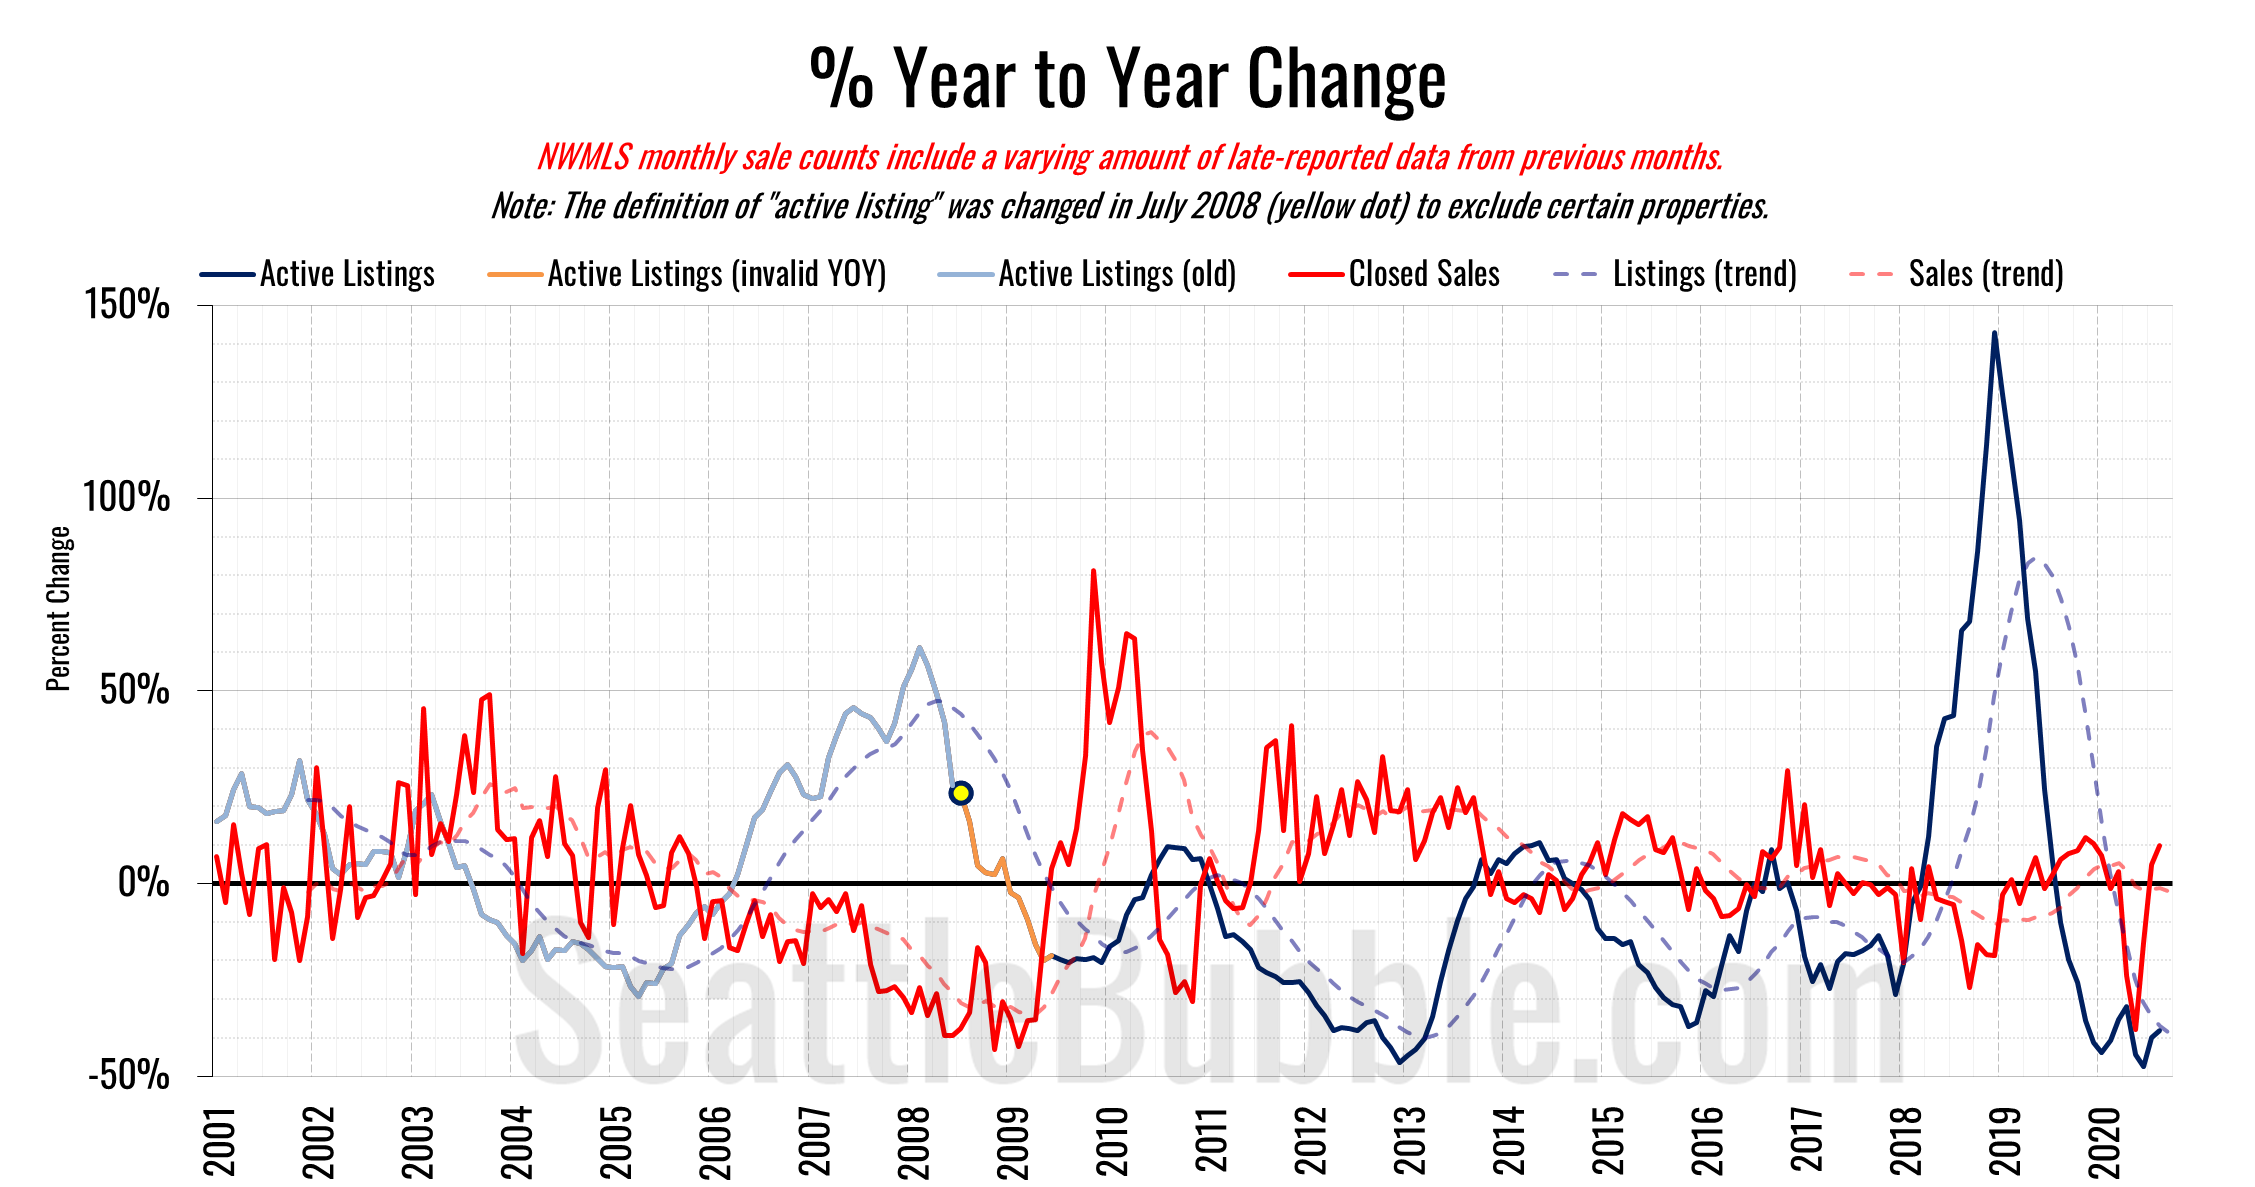
Here’s the supply/demand YOY graph. “Demand” in this chart is represented by closed sales, which have had a consistent definition throughout the decade (unlike pending sales from NWMLS).
Not a pretty picture for homebuyers, with demand on the rise and supply falling.
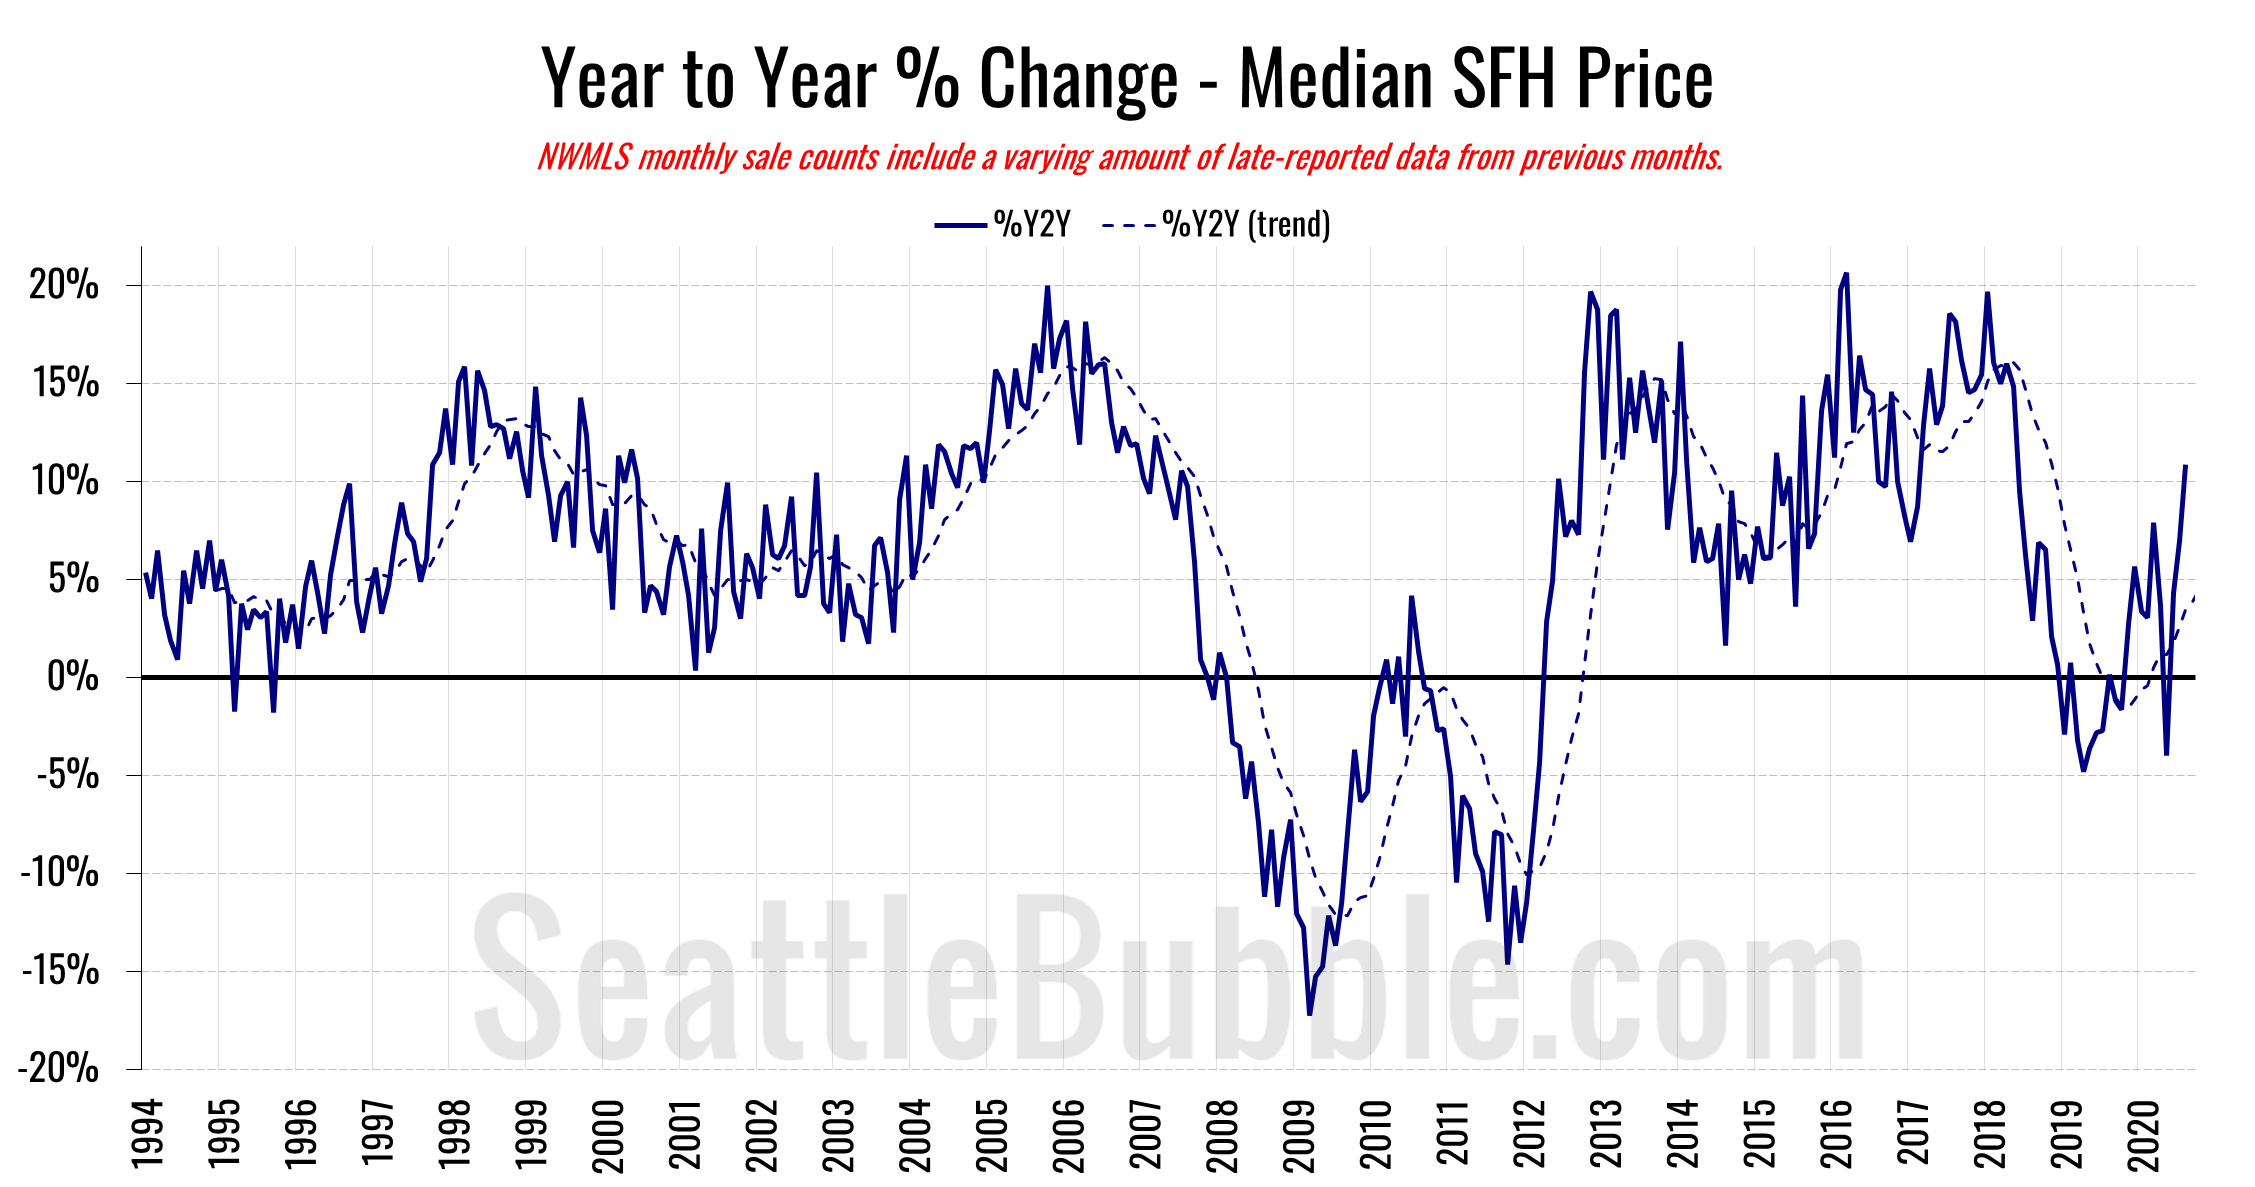
Here’s the median home price YOY change graph:
Year-over-year home price changes jumped up to over 10 percent for the first time in over two years.
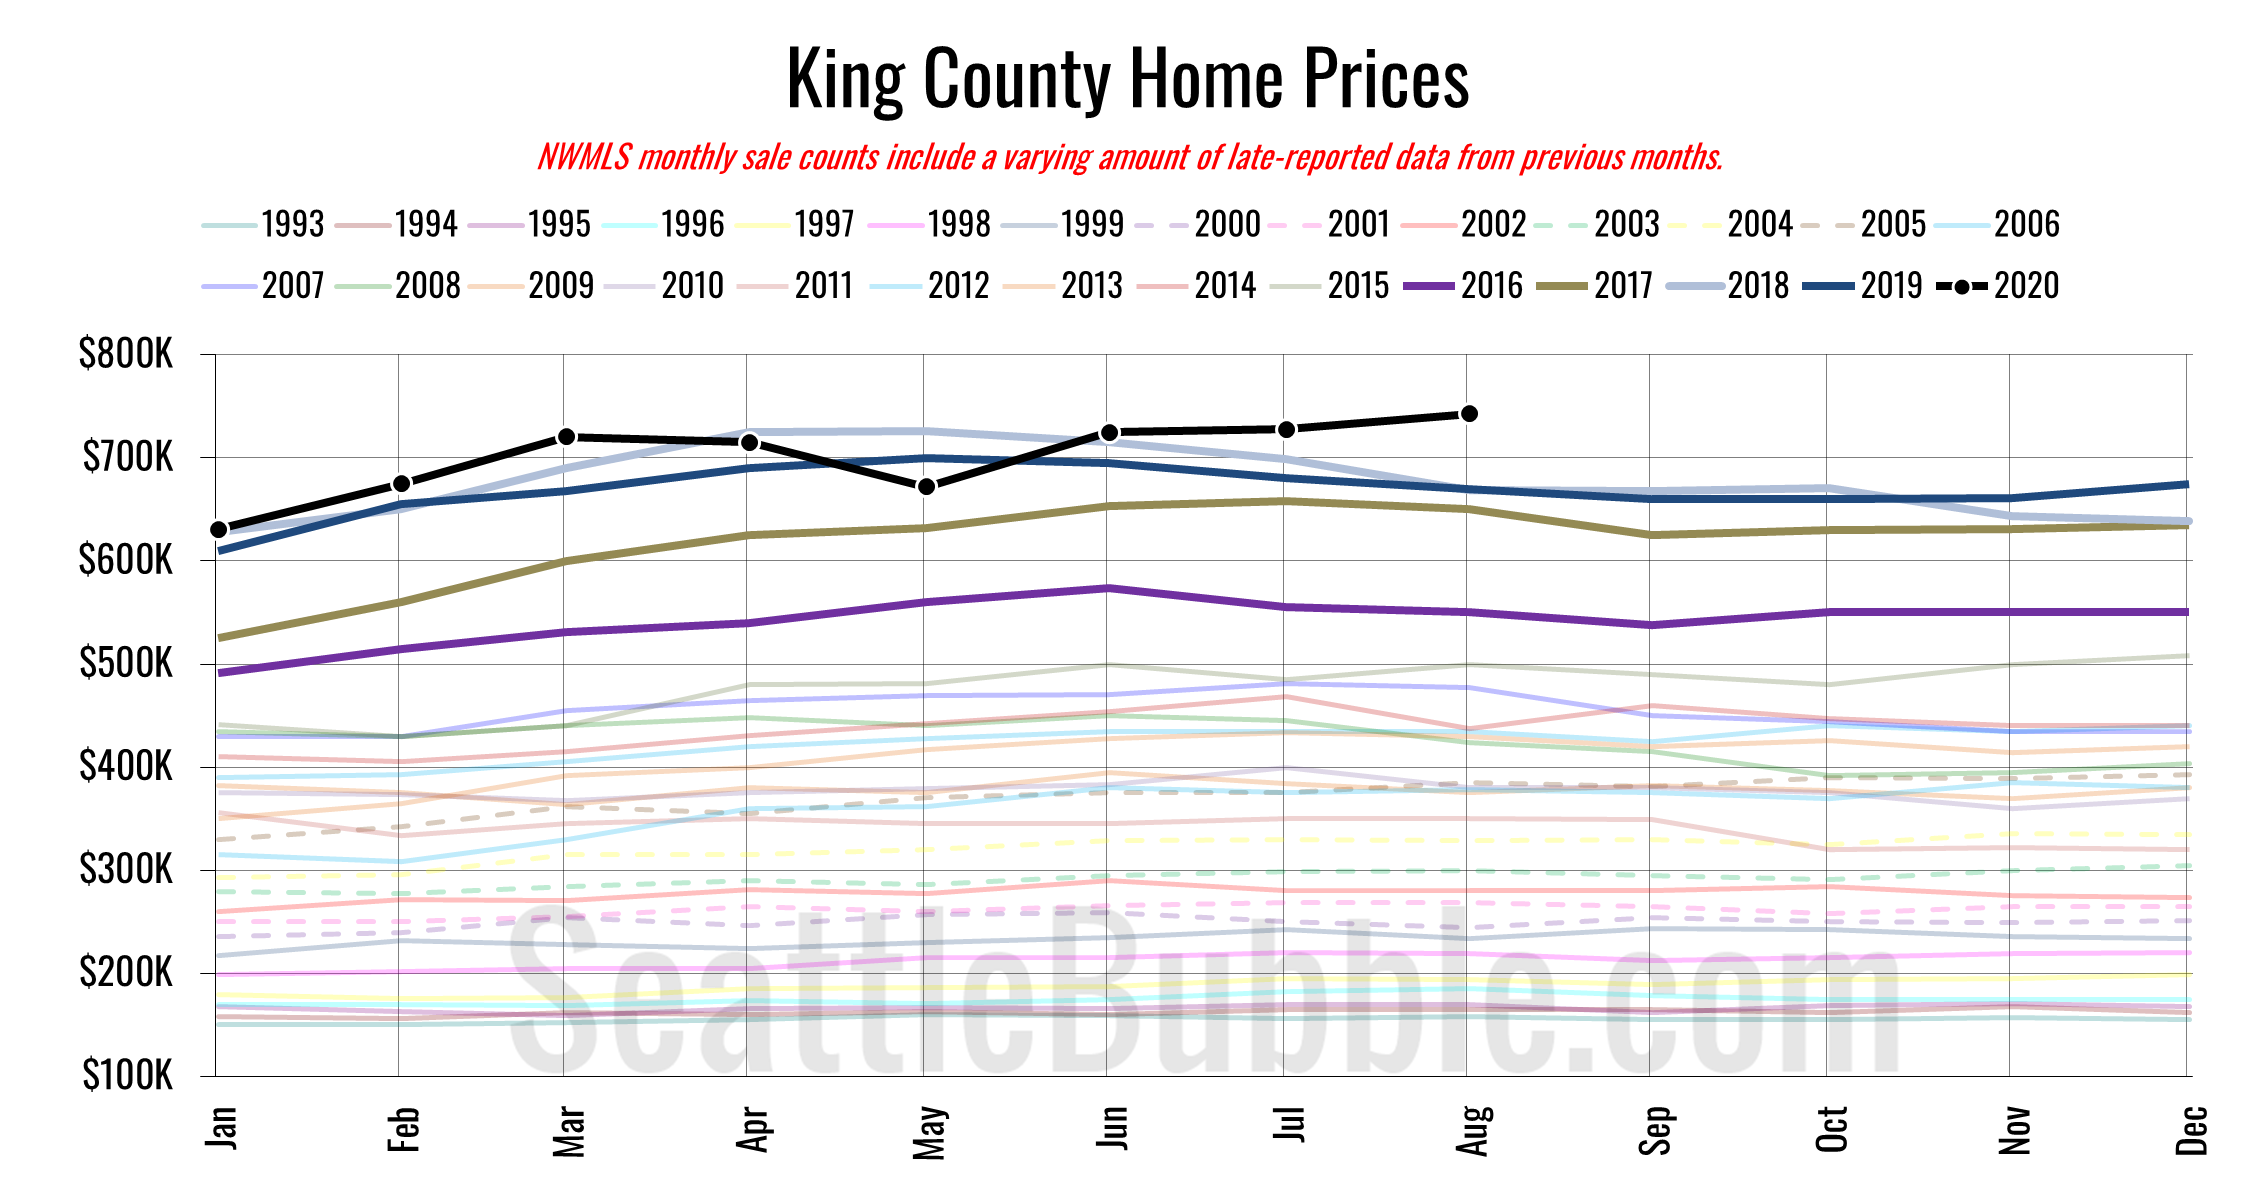
And lastly, here is the chart comparing King County SFH prices each month for every year back to 1994 (not adjusted for inflation).
August 2019: $670,000
August 2020: $742,950
July 2007: $481,000 (previous cycle high)
Here’s the article from the Seattle Times: Western Washington home prices hit new record highs
