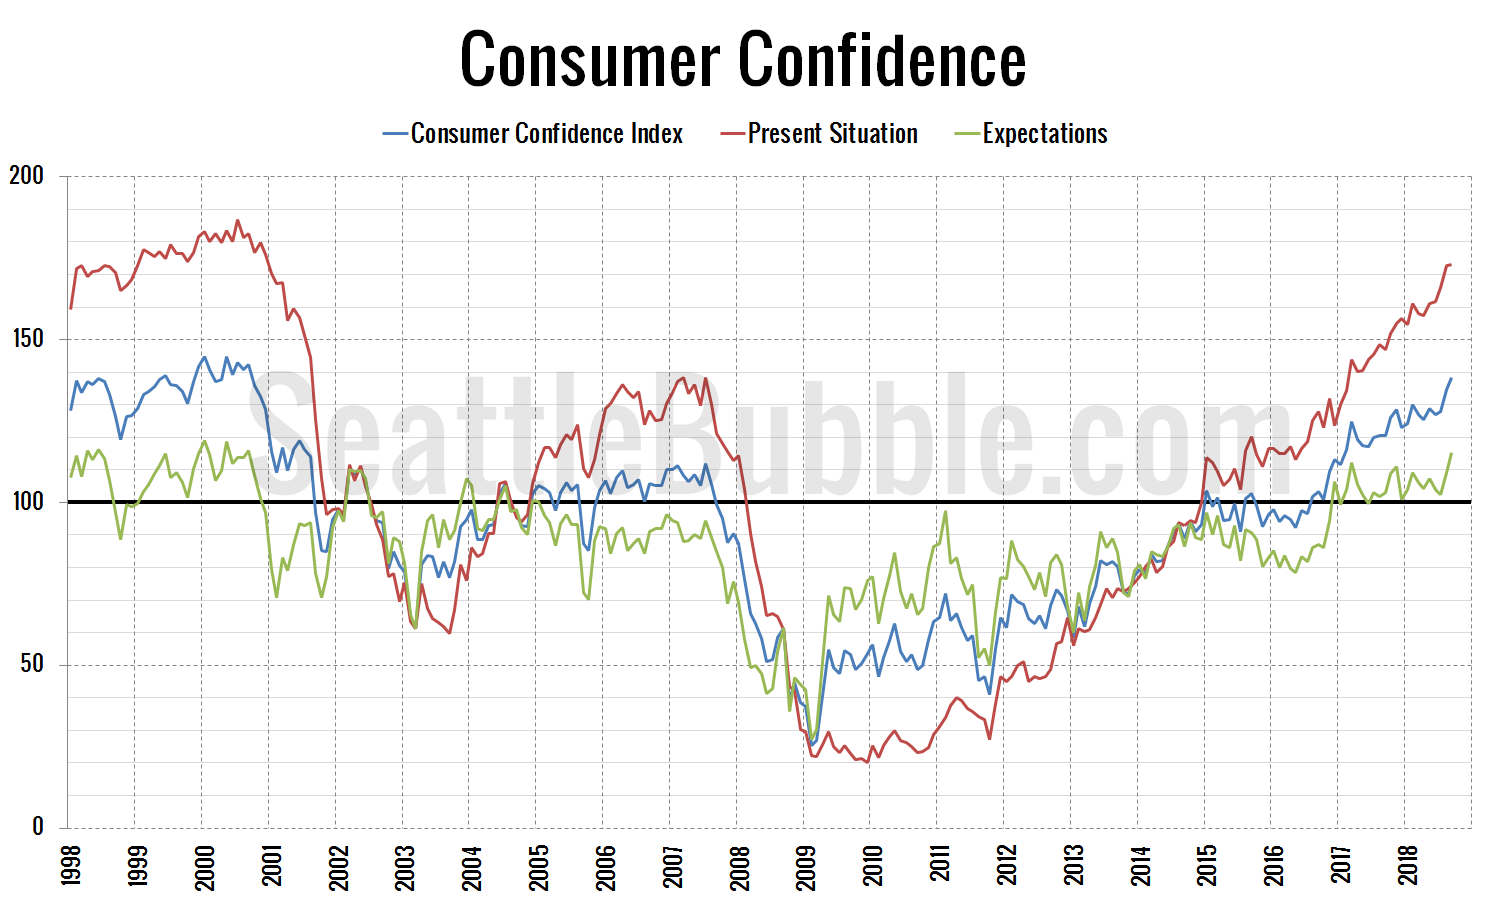
Before the month is over, let’s check in in on the latest data from the Consumer Confidence Index.
The overall Consumer Confidence Index currently sits at 138.4, up three percent in a month and up fifteen percent from a year ago…
local real estate news, statistics, and commentary without the sales spin.
Before the month is over, let’s check in in on the latest data from the Consumer Confidence Index.
The overall Consumer Confidence Index currently sits at 138.4, up three percent in a month and up fifteen percent from a year ago…
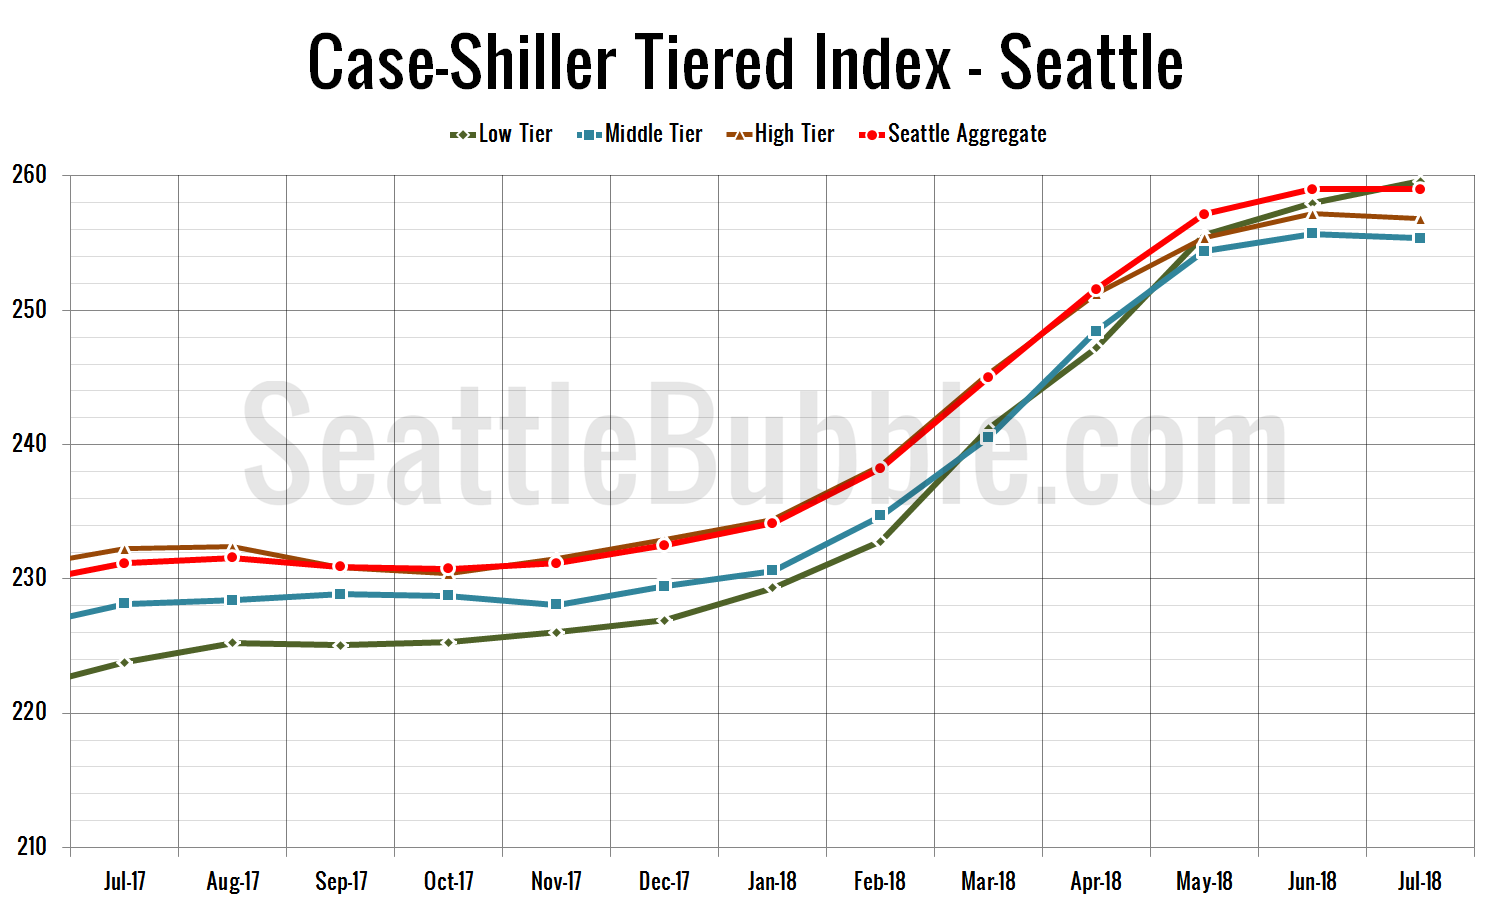
Let’s check out the three price tiers for the Seattle area, as measured by Case-Shiller. Remember, Case-Shiller’s “Seattle” data is based on single-family home repeat sales in King, Pierce, and Snohomish counties.
Only the low tier was up month-over-month once more in July. The middle tier and high tier both fell…
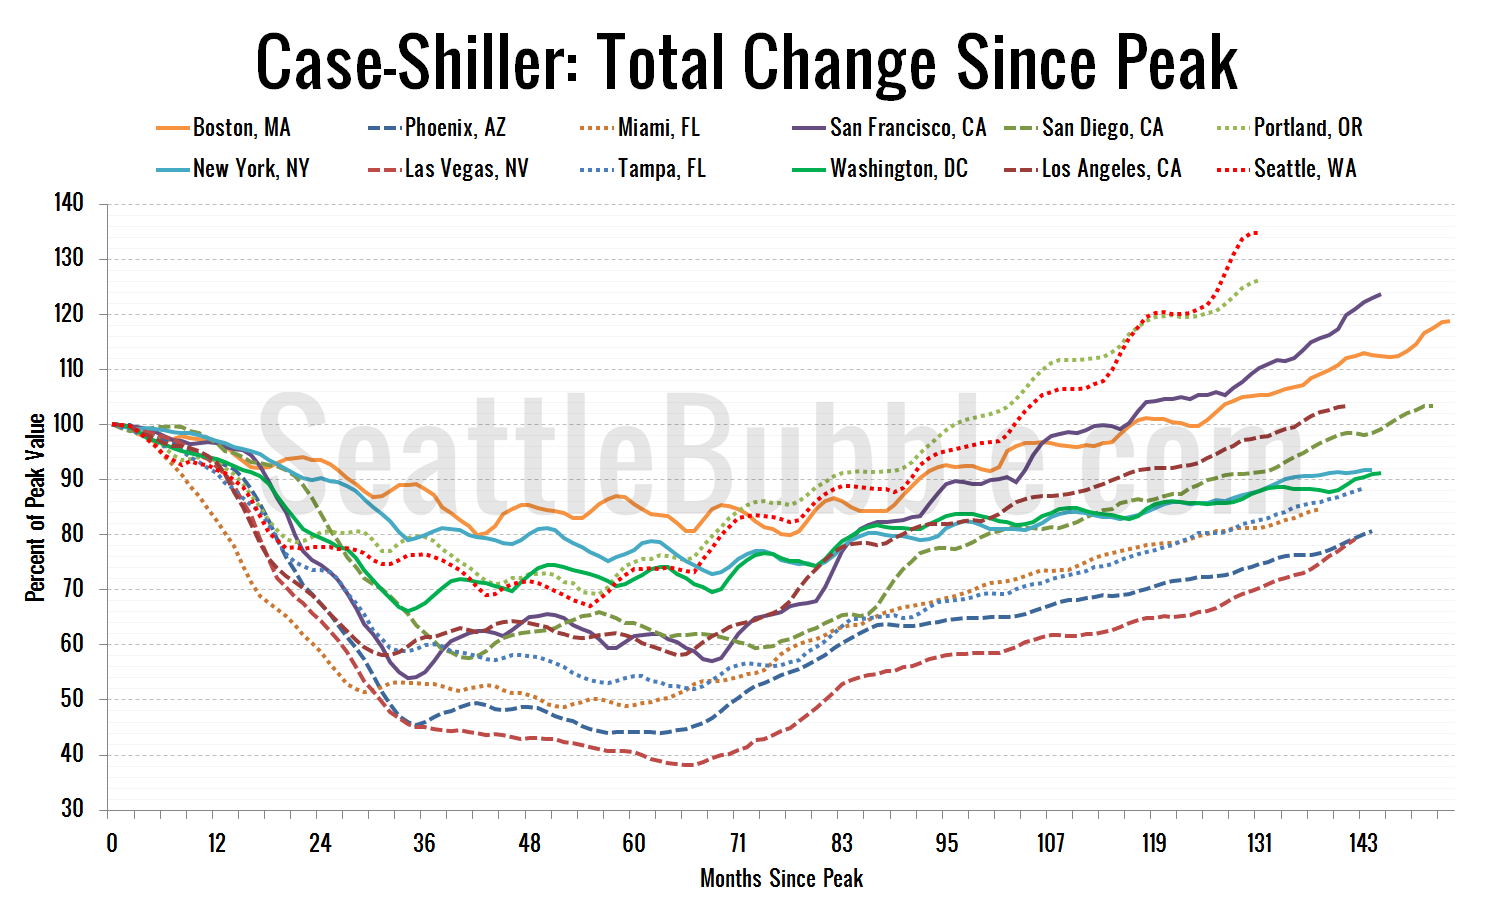
Let’s have a look at the latest data from the Case-Shiller Home Price Index. According to July data that was released today, Seattle-area home prices were:
Down less than 0.1 percent June to July
Up 12.1 percent YOY.
Up 34.7 percent from the July 2007 peak
Last year at this time prices were up 0.7 percent month-over-month and year-over-year prices were up 13.5 percent…

It’s been six months since we took a look at the in-county breakdown data from the NWMLS to see how the sales mix shifted around the county. I like to keep an eye on this not only to see how individual neighborhoods are doing but also to see how the sales mix shift affects the overall county-wide median price.
…
The number of sales in all three tiers has been decreasing month-over-month for the past two months. Month-over-month sales were down five percent in the low tier, down ten percent in the middle tier, and down eight percent in the high tier…
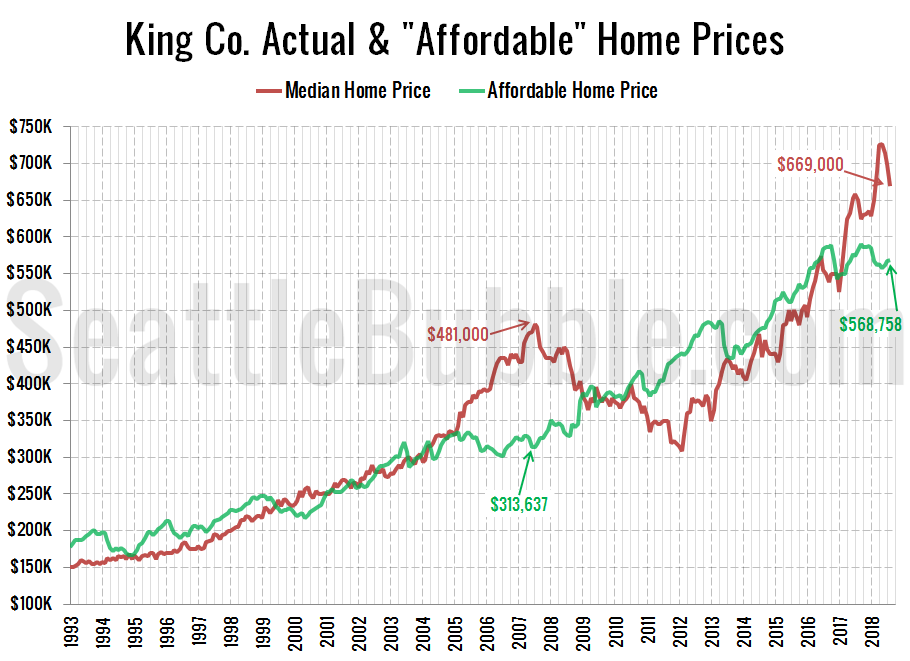
As promised yesterday, here’s an updated look at the “affordable home” price chart.
…
The “affordable” home price has bounced around between about $550,000 and $590,000 since the beginning of 2017. The current “affordable” home price of $568,758 in King County would have a monthly payment of $2,319…