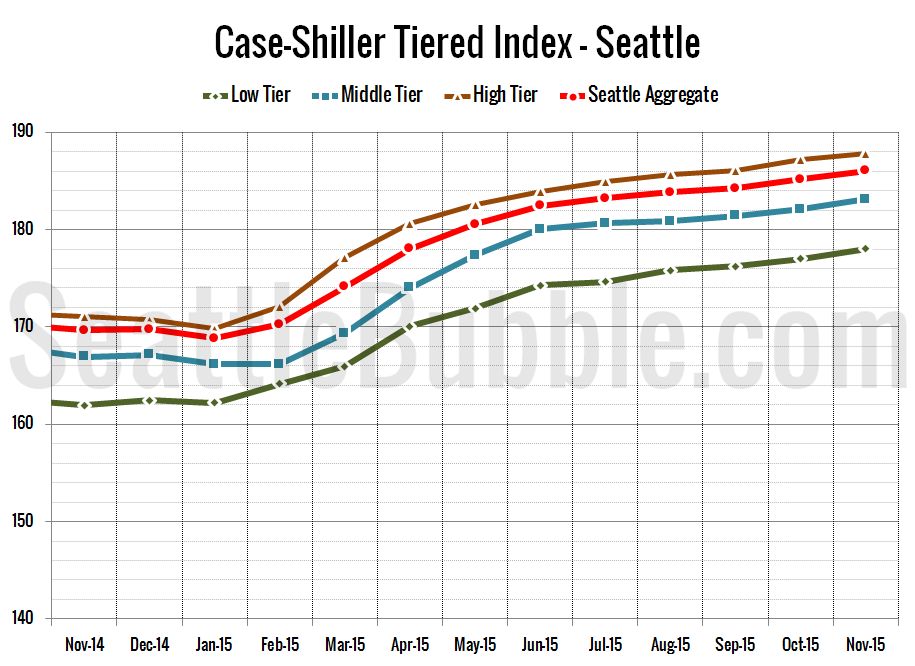
Let’s check out the three price tiers for the Seattle area, as measured by Case-Shiller. Remember, Case-Shiller’s “Seattle” data is based on single-family home repeat sales in King, Pierce, and Snohomish counties. Note that the tiers are determined by sale volume. In other words, 1/3 of all sales fall into each tier. For more details…
Category: Statistics
Statistics, number-based analysis, etc.
Case-Shiller: Seattle Home Price Gains Power Into Winter
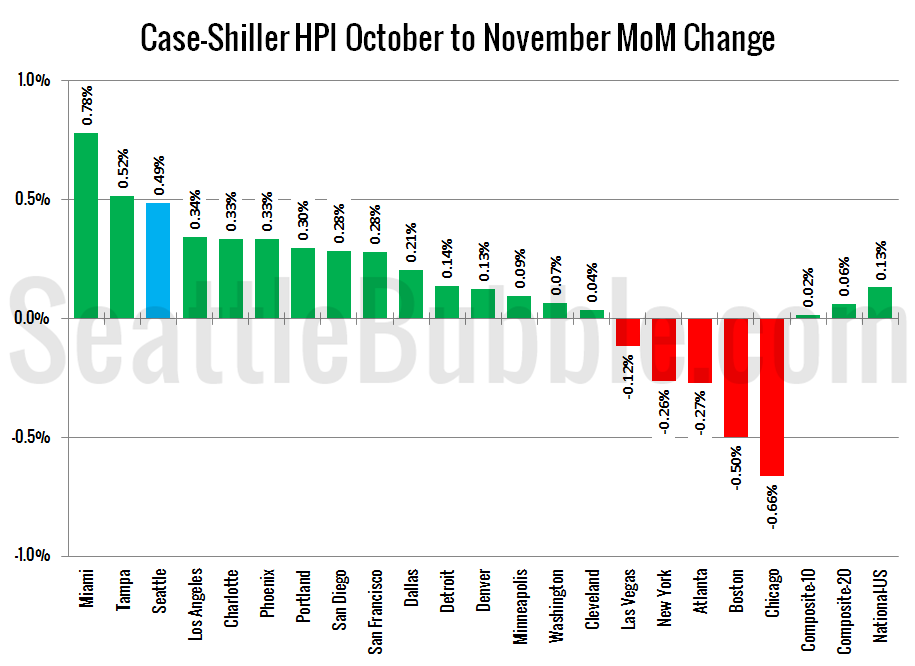
Let’s have a look at the latest data from the Case-Shiller Home Price Index. According to August data that was released today, Seattle-area home prices were: Up 0.5 percent October to November Up 9.7 percent YOY. Down 3.2 percent from the July 2007 peak Over the same period in 2014 prices were down 0.3 percent…
NWMLS: 2015 Was the Worst Year Ever for Home Buyers
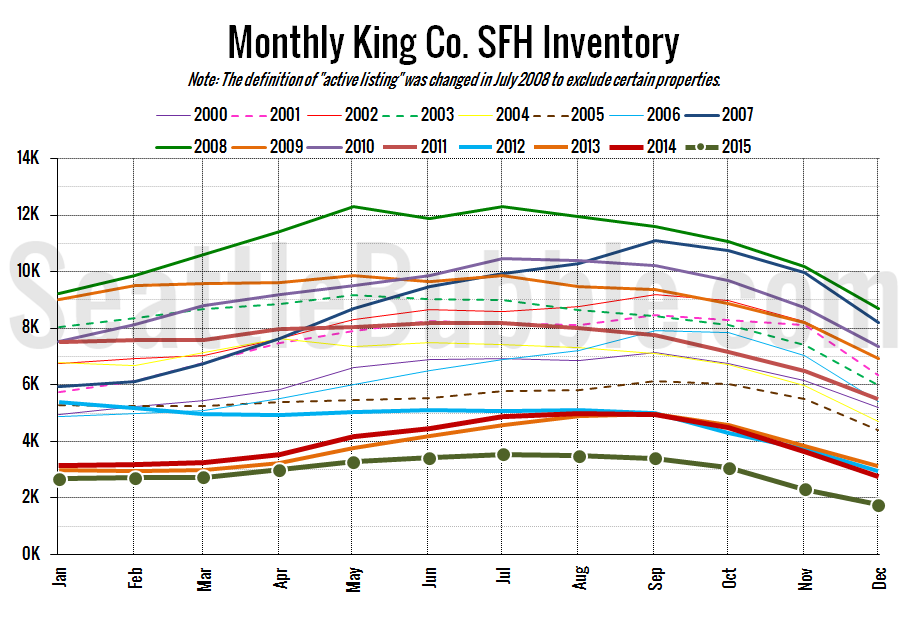
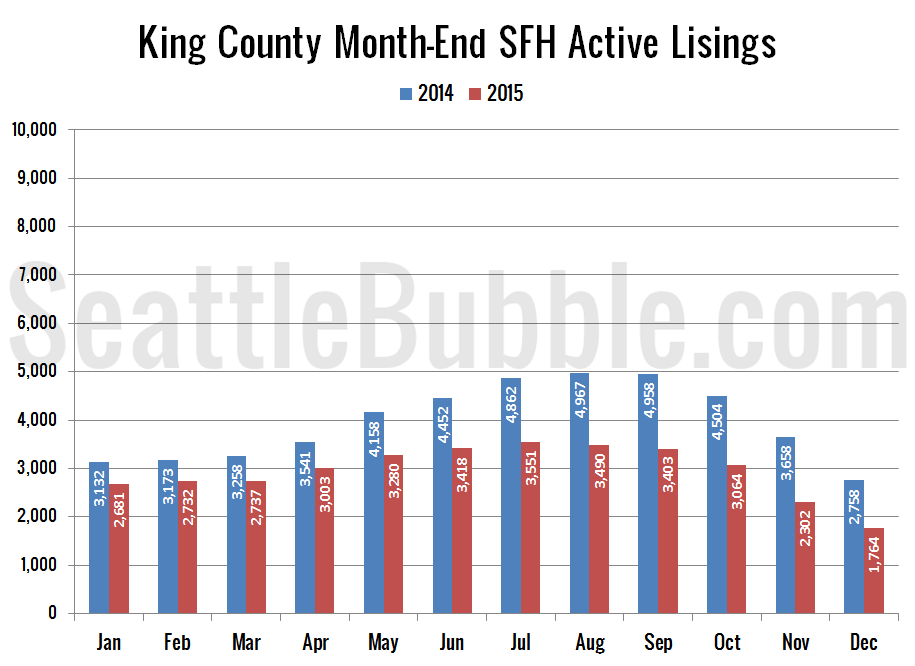
After setting a new all-time low inventory level in November, listings dropped off dramatically yet again to set another new all-time low in December. Here’s hoping we see somewhat of a turnaround in inventory for 2016. If not, expect another overheated year.
We’re Back! December Stats Preview Time
Now that the last month of 2015 is behind us, let’s have a look at our monthly stats preview. Sales actually rose in both counties month-over-month, as inventory fell to new all-time lows. Foreclosure notices are near their low points, and inched up from November in both counties.
NWMLS: Inventory Hits New All-Time Low
November market stats were published by the NWMLS on Friday. This is the first time in quite a while we’ve seen any green arrows for buyers in the summary table. However, it’s hard to get even a little bit excited, given the all-time low inventory level. At this point there are so few homes for sale that it’s going to be difficult for sales to come in very strong.
