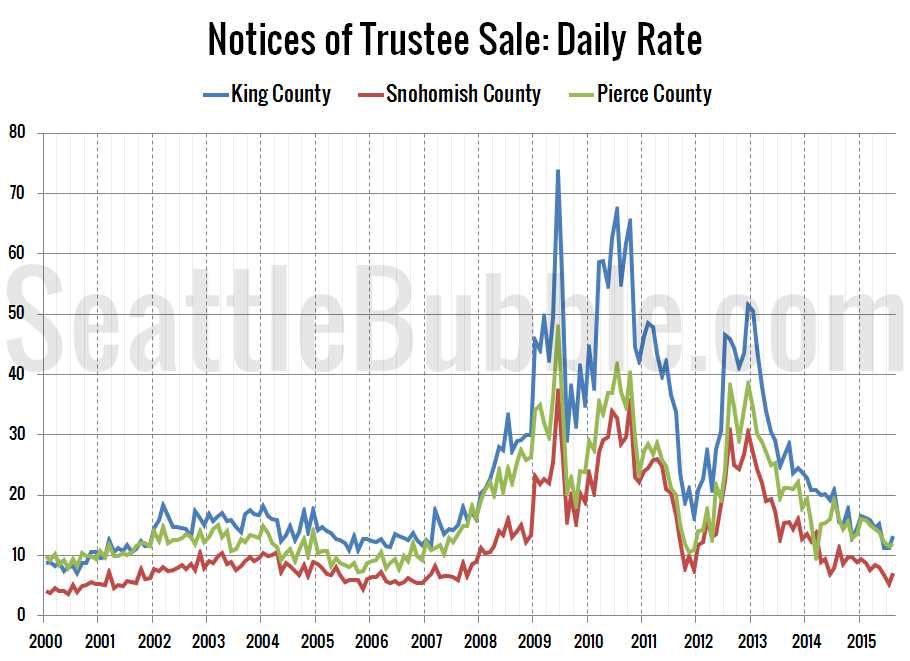
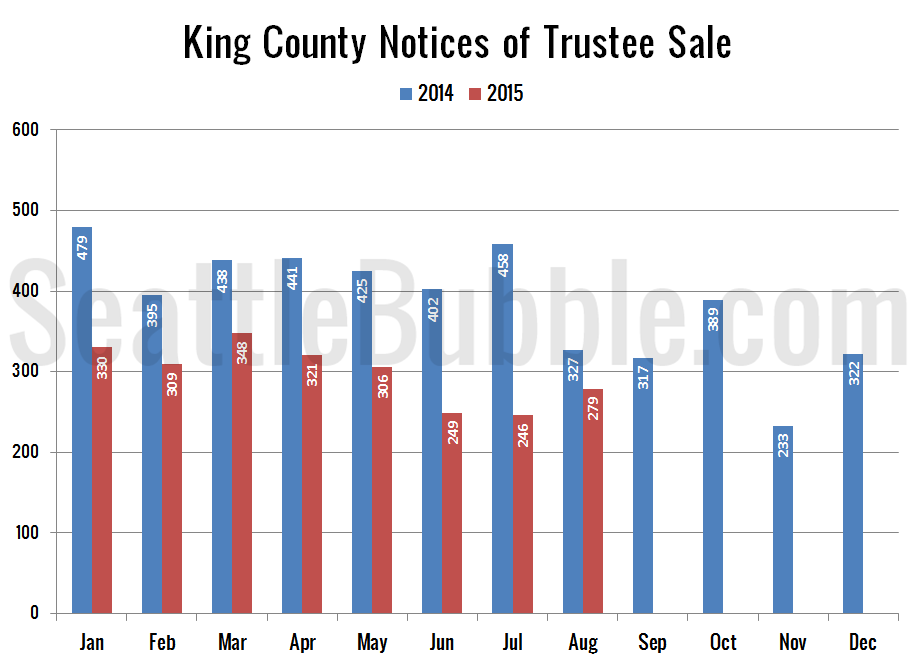
Get access to the full spreadsheets used to make the charts in this and other posts by becoming a member of Seattle Bubble. It’s been a few months since we took a detailed look at foreclosure stats in King, Snohomish, and Pierce counties, so let’s update those numbers. First up, the Notice of Trustee Sale…
Category: Statistics
Statistics, number-based analysis, etc.
Most Neighborhoods See End of Summer Sales Slowdown
Get access to the full spreadsheets used to make the charts in this and other posts by becoming a member of Seattle Bubble. It’s time for us to take a look at this month’s numbers to see how the sales mix shifted around the county in August. In order to explore this concept, we break…
Around the Sound: No Relief for Buyers Anywhere
Get access to the full spreadsheets used to make the charts in this and other posts by becoming a member of Seattle Bubble. It’s been a few months since we updated our monthly stats for the local regions outside of the King/Snohomish core. Here’s your August update to our “Around the Sound” statistics for Pierce,…
NWMLS: Sales Slow in August as Prices Continue Surging
Get access to the full spreadsheets used to make the charts in this and other posts, as well as a variety of additional insider benefits by becoming a member of Seattle Bubble.
August market stats were published by the NWMLS yesterday. Before we get into our monthly stats, here’s a quick look at their press release.
Opinions vary on possibility of a housing slowdown, but numbers show solid activity
[…]
August Stats Preview: Sales Slip But Market Still Strongly Favors Sellers
Get access to the full spreadsheets used to make the charts in this post by becoming a member of Seattle Bubble.
With August now behind us, let’s have a look at our monthly stats preview. First up, here’s the snapshot of all the data as far back as my historical information goes, with the latest, high, and low values highlighted for each series…


