Skip to content

Seattle Bubble

local real estate news, statistics, and commentary without the sales spin.

Menu
  • Home
  • About
  • Contact
  • Reference
  • Speaking
Menu

Category: Statistics

Statistics, number-based analysis, etc.

Seattle & South King Sales Up as Eastside Sales Slip

Posted on November 10, 2014November 10, 2014 by The Tim

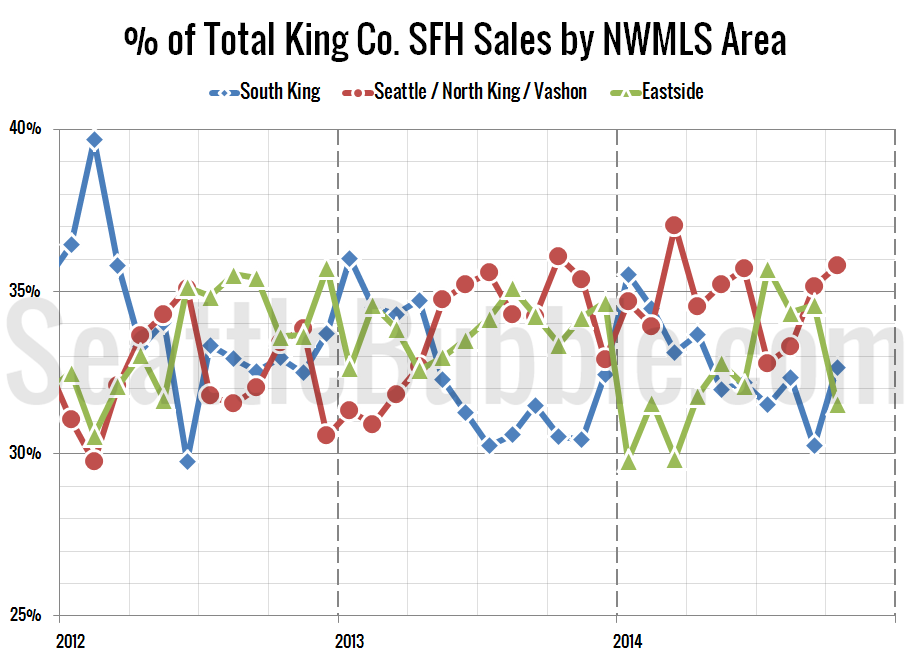
It’s time once again to take an updated look at how King County’s sales are shifting between the different regions around the county, since geographic shifts can and do affect the median price. In order to explore this concept, we break King County down into three regions, based on the NWMLS-defined “areas”: low end: South…

Share:

  • Twitter
  • LinkedIn
  • Facebook
  • Reddit
  • Pinterest
  • Email

NWMLS: Prices Sag as Sales Stay Strong

Posted on November 5, 2014 by The Tim

October market stats were published by the NWMLS today. They haven’t published their press release to its typical location yet, so let’s just dive right into our usual monthly stats. CAUTION NWMLS monthly reports include an undisclosed and varying number ofsales from previous months in their pending and closed sales statistics. Here’s your King County…

Share:

  • Twitter
  • LinkedIn
  • Facebook
  • Reddit
  • Pinterest
  • Email

Consumer Confidence Hit a Seven-Year High in October

Posted on November 4, 2014September 26, 2018 by The Tim

Before the NWMLS data hits this week let’s check in on how Consumer Confidence and mortgage interest rates fared during October. First up, here’s the Consumer Confidence data as of October: The overall Consumer Confidence Index currently sits at 94.5, up 6 percent in a month and up 31 percent from a year ago. At…

Share:

  • Twitter
  • LinkedIn
  • Facebook
  • Reddit
  • Pinterest
  • Email

October Stats Preview: Late Sales Rally Edition

Posted on November 3, 2014November 3, 2014 by The Tim

With October now in the past, let’s have a look at our monthly stats preview. Most of the charts below are based on broad county-wide data that is available through a simple search of King County and Snohomish County public records. If you have additional stats you’d like to see in the preview, drop a…

Share:

  • Twitter
  • LinkedIn
  • Facebook
  • Reddit
  • Pinterest
  • Email

Price Gains Shrinking in All Twenty Case-Shiller Cities

Posted on October 30, 2014October 30, 2014 by The Tim

It’s been a few months since we last had a look at my favorite alternative Case-Shiller charts. First up, let’s have a look at the chart that depicts the count of cities showing second derivative (month-over-month changes in the year-over-year changes) gains or losses. For the last three months of data, every single city has…

Share:

  • Twitter
  • LinkedIn
  • Facebook
  • Reddit
  • Pinterest
  • Email

Posts navigation

  • Previous
  • 1
  • …
  • 47
  • 48
  • 49
  • 50
  • 51
  • 52
  • 53
  • …
  • 222
  • Next

Tim’s Other Projects

Dispatches from the Multiverse

Tip Jar

Like what we're doing?

Drop us a tip!

Accounts

  • Log in
  • Entries feed
  • Comments feed
  • WordPress.org
©2024 Seattle Bubble | Built using WordPress and Responsive Blogily theme by Superb