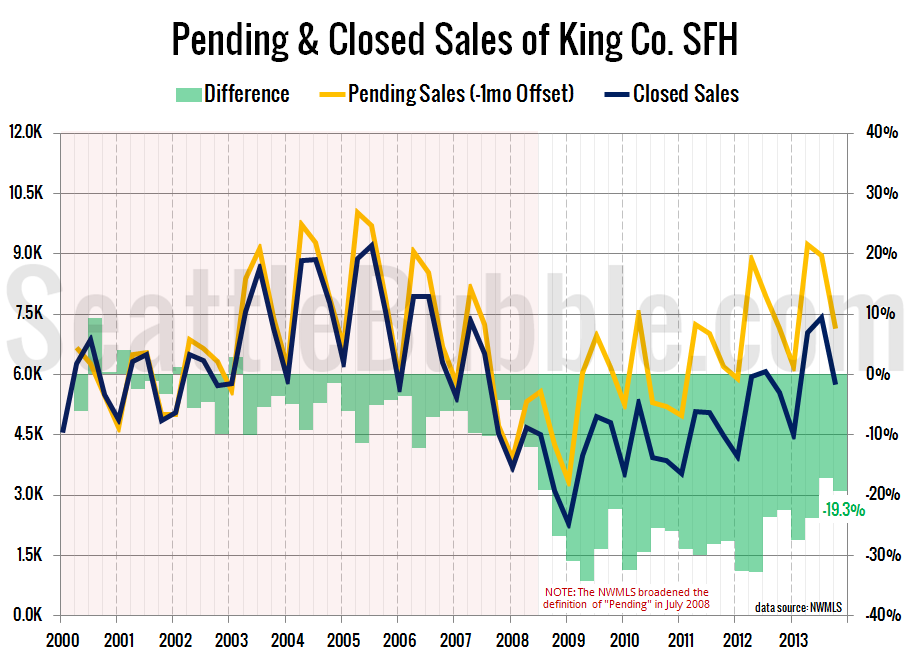
Let’s take a look a the latest data on pending sales volume versus closed sales volume. For this series I roll the pending sales and closed sales data up by quarter, with pending sales offset by one month. In other words, the fourth quarter numbers below represent pending sales from September, October, and November and…
Category: Statistics
Statistics, number-based analysis, etc.
Around the Sound: Inventory Increases Across Most Counties
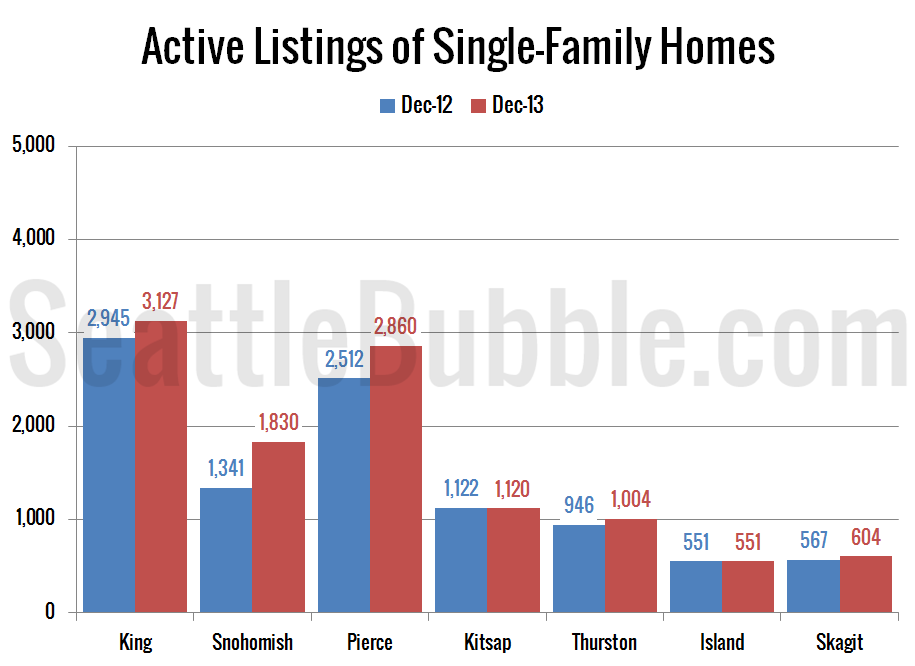
It’s time for us to check up on stats outside of the King/Snohomish core with our “Around the Sound” statistics for Pierce, Kitsap, Thurston, Island, Skagit, and Whatcom counties. If there is certain data you would like to see or ways you would like to see the data presented differently, drop a comment below and…
Median Price Dips on Eastside, Climbs in South King
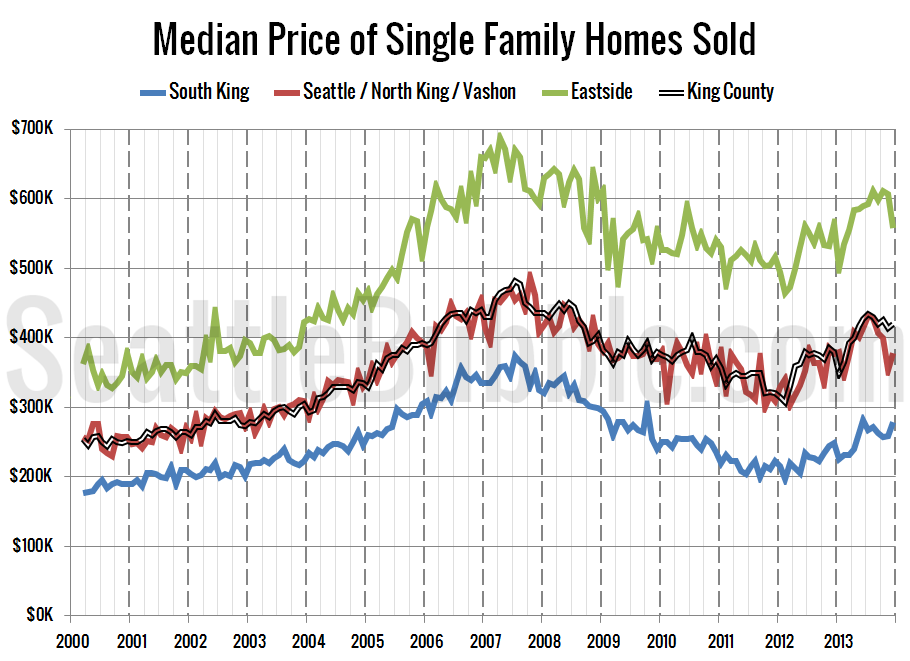
It’s time once again to take an updated look at how King County’s sales are shifting between the different regions around the county, since geographic shifts can and do affect the median price. In order to explore this concept, we break King County down into three regions, based on the NWMLS-defined “areas”: low end: South…
NWMLS: Inventory Up Six Percent to End 2013
December market stats were published by the NWMLS this afternoon. Here’s a snippet from their press release: Year-end gains in inventory, sales, prices. Brokers with Northwest Multiple Listing Service ended 2013 with the best year-over-year improvement in inventory (up 8.4 percent) and a similar gain in closed sales to buoy confidence heading into the new…
December Stats Preview: Better for Buyers Edition
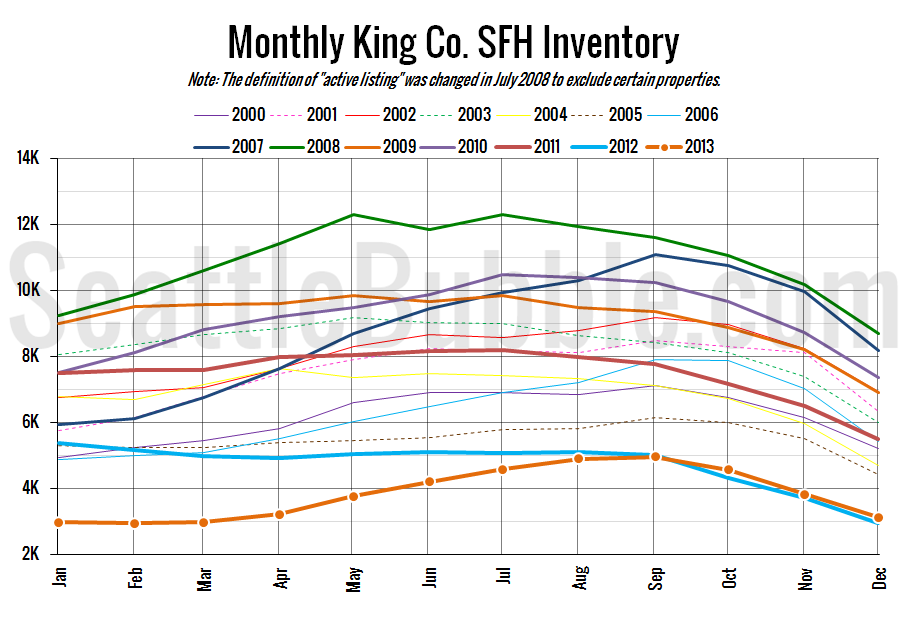
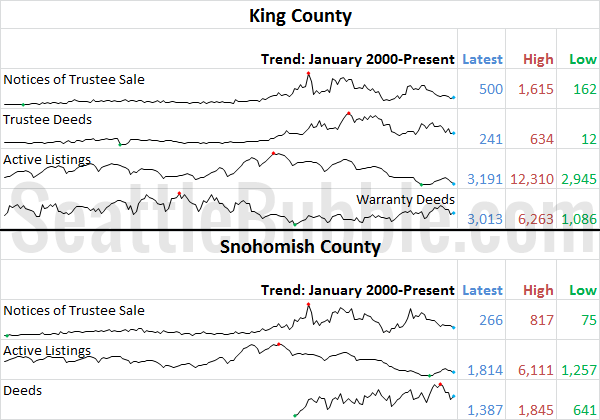
With the last month of 2013 now in the history books, let’s have a look at our stats preview. Most of the charts below are based on broad county-wide data that is available through a simple search of King County and Snohomish County public records. If you have additional stats you’d like to see in…
