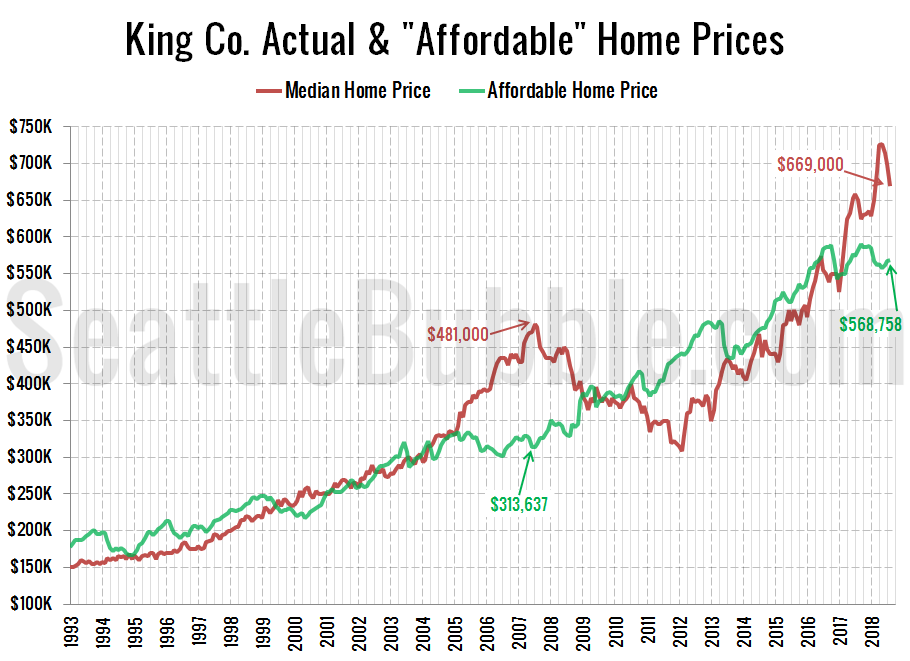
As promised yesterday, here’s an updated look at the “affordable home” price chart.
…
The “affordable” home price has bounced around between about $550,000 and $590,000 since the beginning of 2017. The current “affordable” home price of $568,758 in King County would have a monthly payment of $2,319…
Low affordability may be why sales are stalling out
By popular request, let’s take a look at our affordability index charts for the counties around Puget Sound.
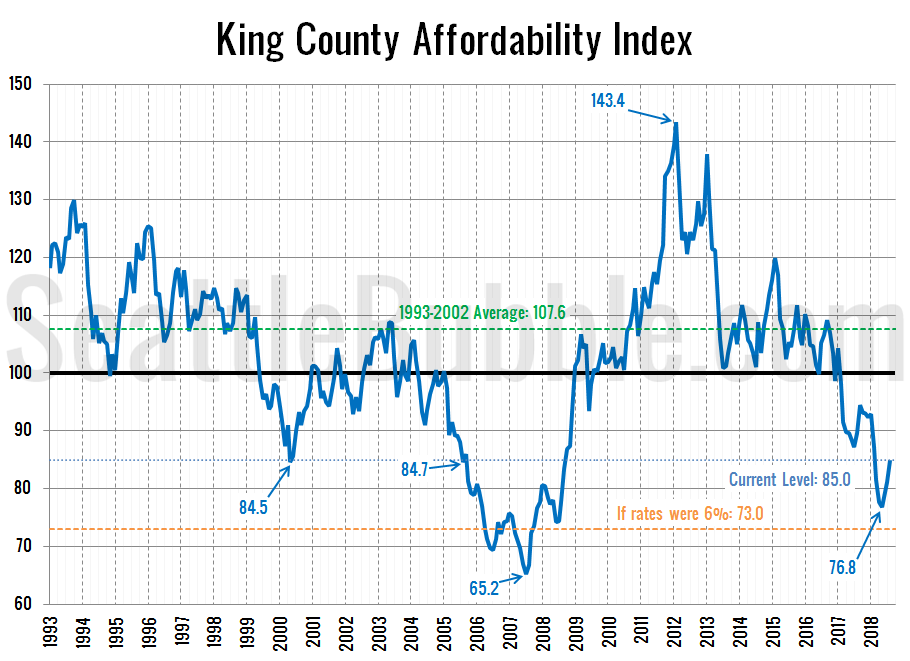
As of August, the affordability index has bounced up slightly from its May low (which was the lowest point since nearly a decade ago in July 2008), but still sits at the very low level of 85.0.
For context, eighty-six percent of the 306 months on record back through 1993 have had a higher affordability index than what we had in August 2018…
New listing absorption softens more as pending sales slip
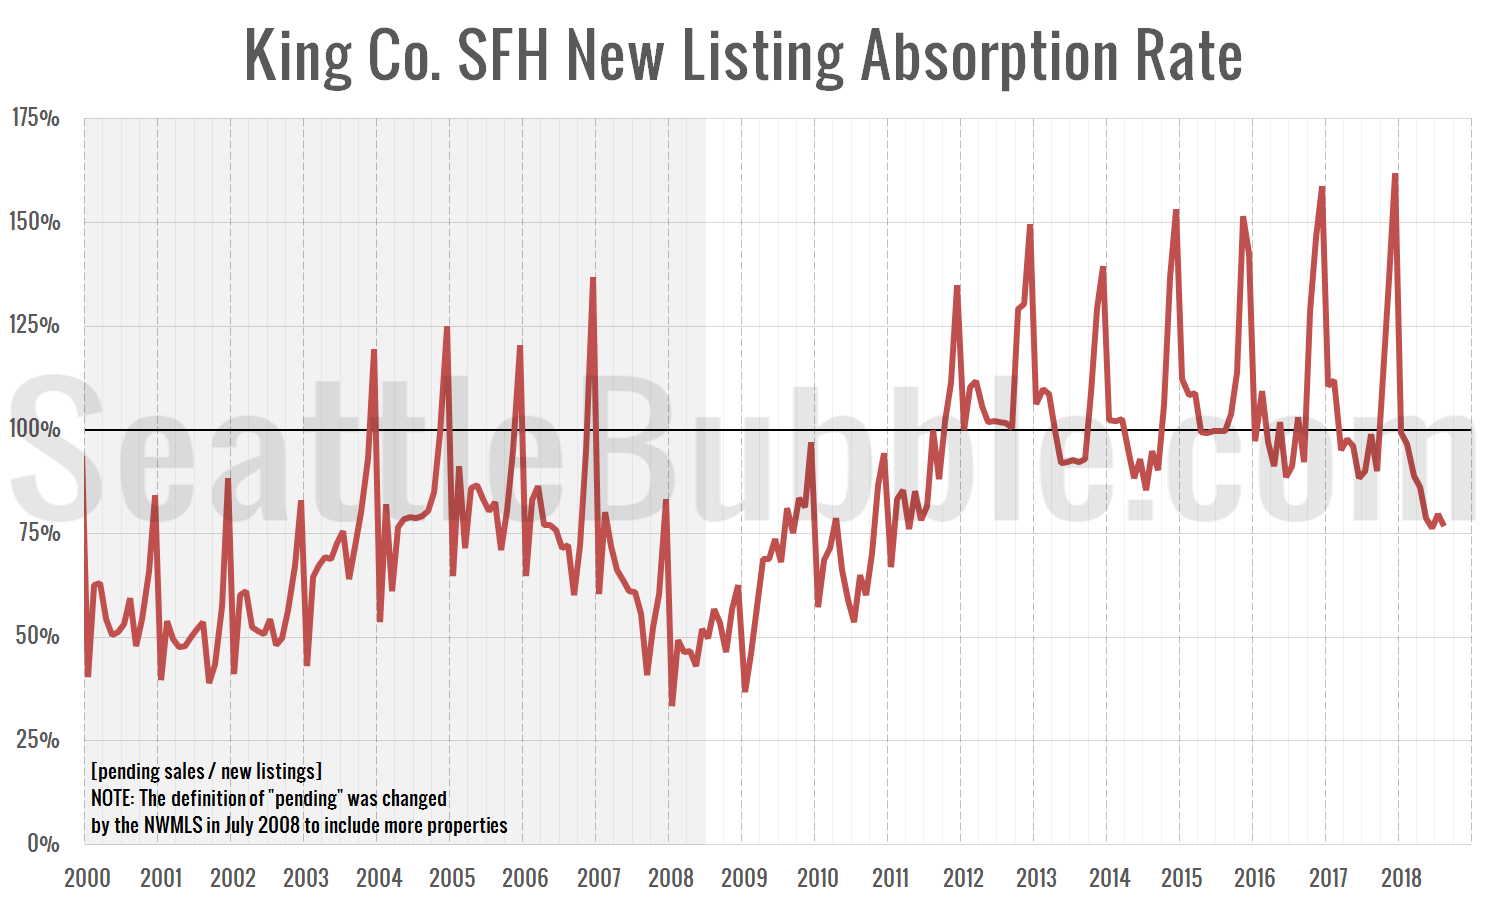
I’ve got a few charts to update you with, but let’s start with a few charts that sum up the state of King County single-family listings, inventory, and pending sales.
After five or six years of the same story month after month—fewer listings, more sales, soaring prices—the market has definitely turned in 2018. Pending sales are now on the decline and inventory is rising rapidly. Let’s see what this looks like in charts…
Summer 2018 slowdown link roundup
There have been a lot of stories in recent weeks about the housing market slowing down, not just in Seattle, but across the country. I thought I would post a quick roundup of some of the stories I’m seeing…
NWMLS: Prices retreat slightly as inventory continues to climb
July market stats were published by the NWMLS yesterday. The biggest news is still the climb in inventory, which is up 256 percent from the all-time low that was set back in December. If the current trend continues (a big “if”), it’s entirely possible that by the end of this year inventory will be at its highest point since 2011.