Skip to content

Seattle Bubble

local real estate news, statistics, and commentary without the sales spin.

Menu
  • Home
  • About
  • Contact
  • Reference
  • Speaking
Menu

Poll: How many levels do you prefer in your home?

Posted on June 23, 2013June 30, 2013 by The Tim

This poll was active 06.23.2013 through 06.29.2013

Share:

  • Twitter
  • LinkedIn
  • Facebook
  • Reddit
  • Pinterest
  • Email

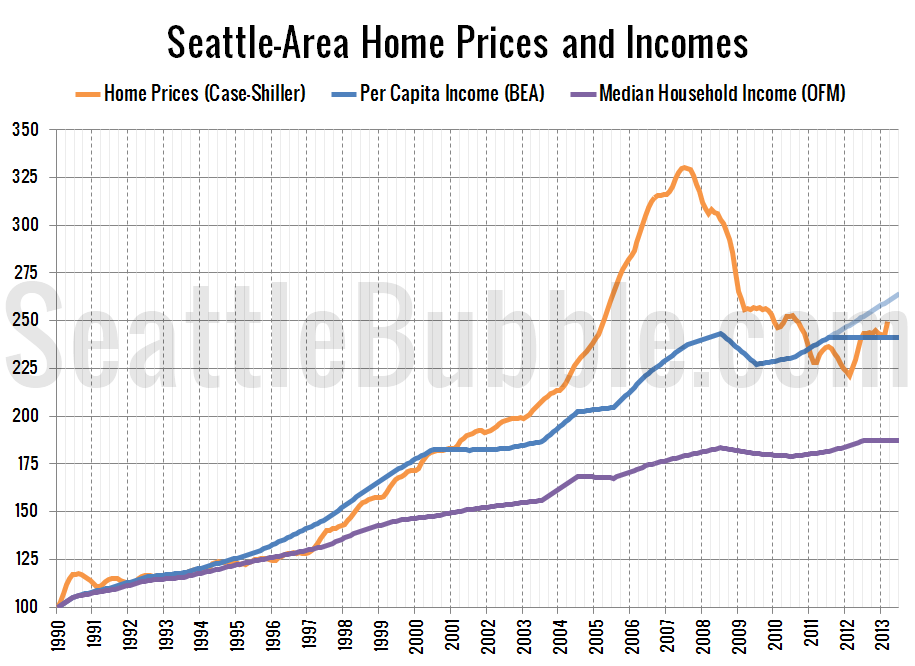
Seattle-Area Price to Income Ratio Near Historic Average

Posted on June 21, 2013June 21, 2013 by The Tim

It’s been a while since we’ve taken look at how local home prices compare to local incomes, so let’s update those charts. First, let’s check out the ratio between home prices and per capita income from the BEA: Overall the Seattle area is just a little bit above the long-term average, and almost entirely thanks…

Share:

  • Twitter
  • LinkedIn
  • Facebook
  • Reddit
  • Pinterest
  • Email

Seattle-Area Adds More Jobs, Unemployment Dips Below 5%

Posted on June 20, 2013June 20, 2013 by The Tim

New local job stats came out this week, so let’s have a look at the Seattle area’s employment situation. First up, year-over-year job growth, broken down into a few relevant sectors: Construction growth dipped again, and has fallen from a 10.2% year-over-year gain in January to 3.1% in May. With 5.7% year-over-year growth, the retail…

Share:

  • Twitter
  • LinkedIn
  • Facebook
  • Reddit
  • Pinterest
  • Email

Can Banks Seek Deficiency Judgment in Washington State?

Posted on June 19, 2013June 20, 2013 by The Tim

Over the weekend the Washington Post published a story about former homeowners who find themselves owing money on a home they lost to foreclosure years earlier: Lenders seek court actions against homeowners years after foreclosure. It’s a process called “deficiency judgment,” and it’s not really news to anyone who has paid attention to housing over…

Share:

  • Twitter
  • LinkedIn
  • Facebook
  • Reddit
  • Pinterest
  • Email

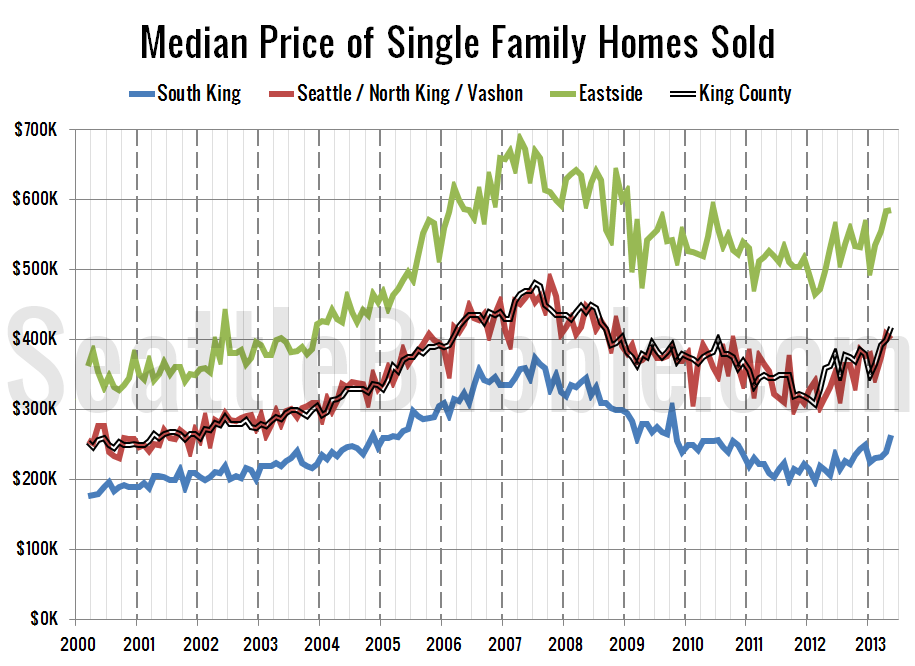
Seattle Sales Gain, Cheap South King Sales Slip

Posted on June 18, 2013June 18, 2013 by The Tim

Let’s take an updated look at how King County’s sales are shifting between the different regions around the county, since geographic shifts can and do affect the median price. In order to explore this concept, we break King County down into three regions, based on the NWMLS-defined “areas”: low end: South County (areas 100-130 &…

Share:

  • Twitter
  • LinkedIn
  • Facebook
  • Reddit
  • Pinterest
  • Email

Posts navigation

  • Previous
  • 1
  • …
  • 139
  • 140
  • 141
  • 142
  • 143
  • 144
  • 145
  • …
  • 717
  • Next

Tim’s Other Projects

Dispatches from the Multiverse

Current Market Stats

Charts courtesy Altos Research
Real Estate Market Chart by Altos Research www.altosresearch.com

Real Estate Market Chart by Altos Research www.altosresearch.com

Real Estate Market Chart by Altos Research www.altosresearch.com

Real Estate Market Chart by Altos Research www.altosresearch.com

News Categories

  • News (1,253)
    • Local (223)
    • National (46)
    • International (1)
    • Audio & Video (60)
    • Humor (43)
    • Opinion (88)
    • Uncategorized (314)
  • Features (558)
  • Statistics (1,109)
    • Counties (724)
    • Neighborhoods (100)
  • Economy (74)
  • Extras (491)
    • Polls (381)
    • Flickr Group (1)
    • Announcements (38)
    • Administrative (78)

Archives

Tip Jar

Like what we're doing?

Drop us a tip!

Accounts

  • Log in
  • Entries feed
  • Comments feed
  • WordPress.org
©2024 Seattle Bubble | Built using WordPress and Responsive Blogily theme by Superb