Let’s have a look at the latest data from the Case-Shiller Home Price Index. According to November data that was released this morning, Seattle-area home prices were: Up 0.2 percent October to November Up 10.4 percent YOY. Up 6.8 percent from the July 2007 peak Over the same period last year prices were up 0.4…
Huge 2017 Apartment Boom Should Soften Housing Market
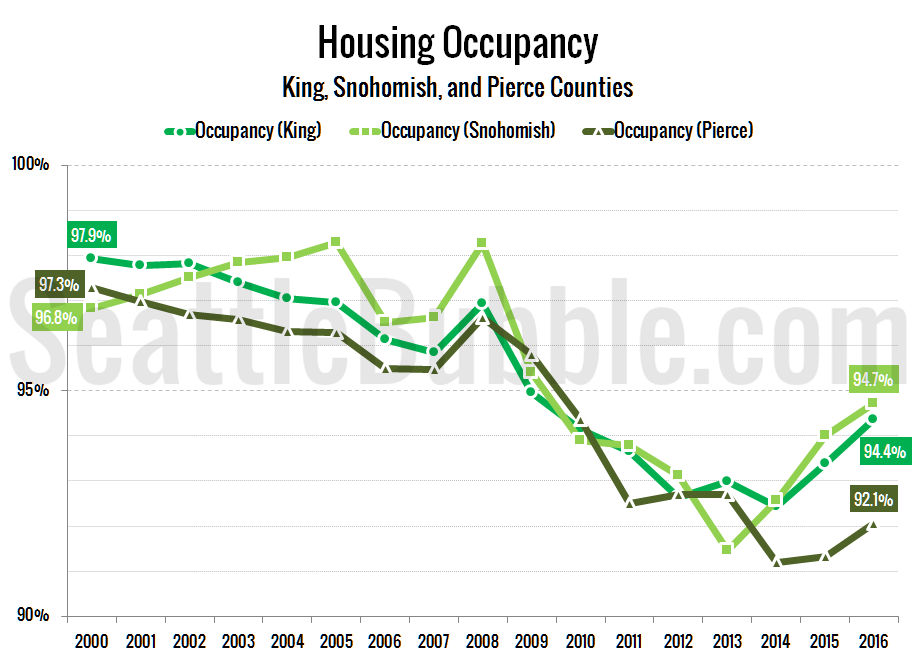
Get access to the full spreadsheets used to make the charts in this and other posts by becoming a member of Seattle Bubble. Good news for renters (and maybe hopeful home buyers, as well): 2017 should see the beginning of relief for the Seattle area’s crazy rental housing market. The infamous $750-a-month 130-square-foot ‘prison cell’…
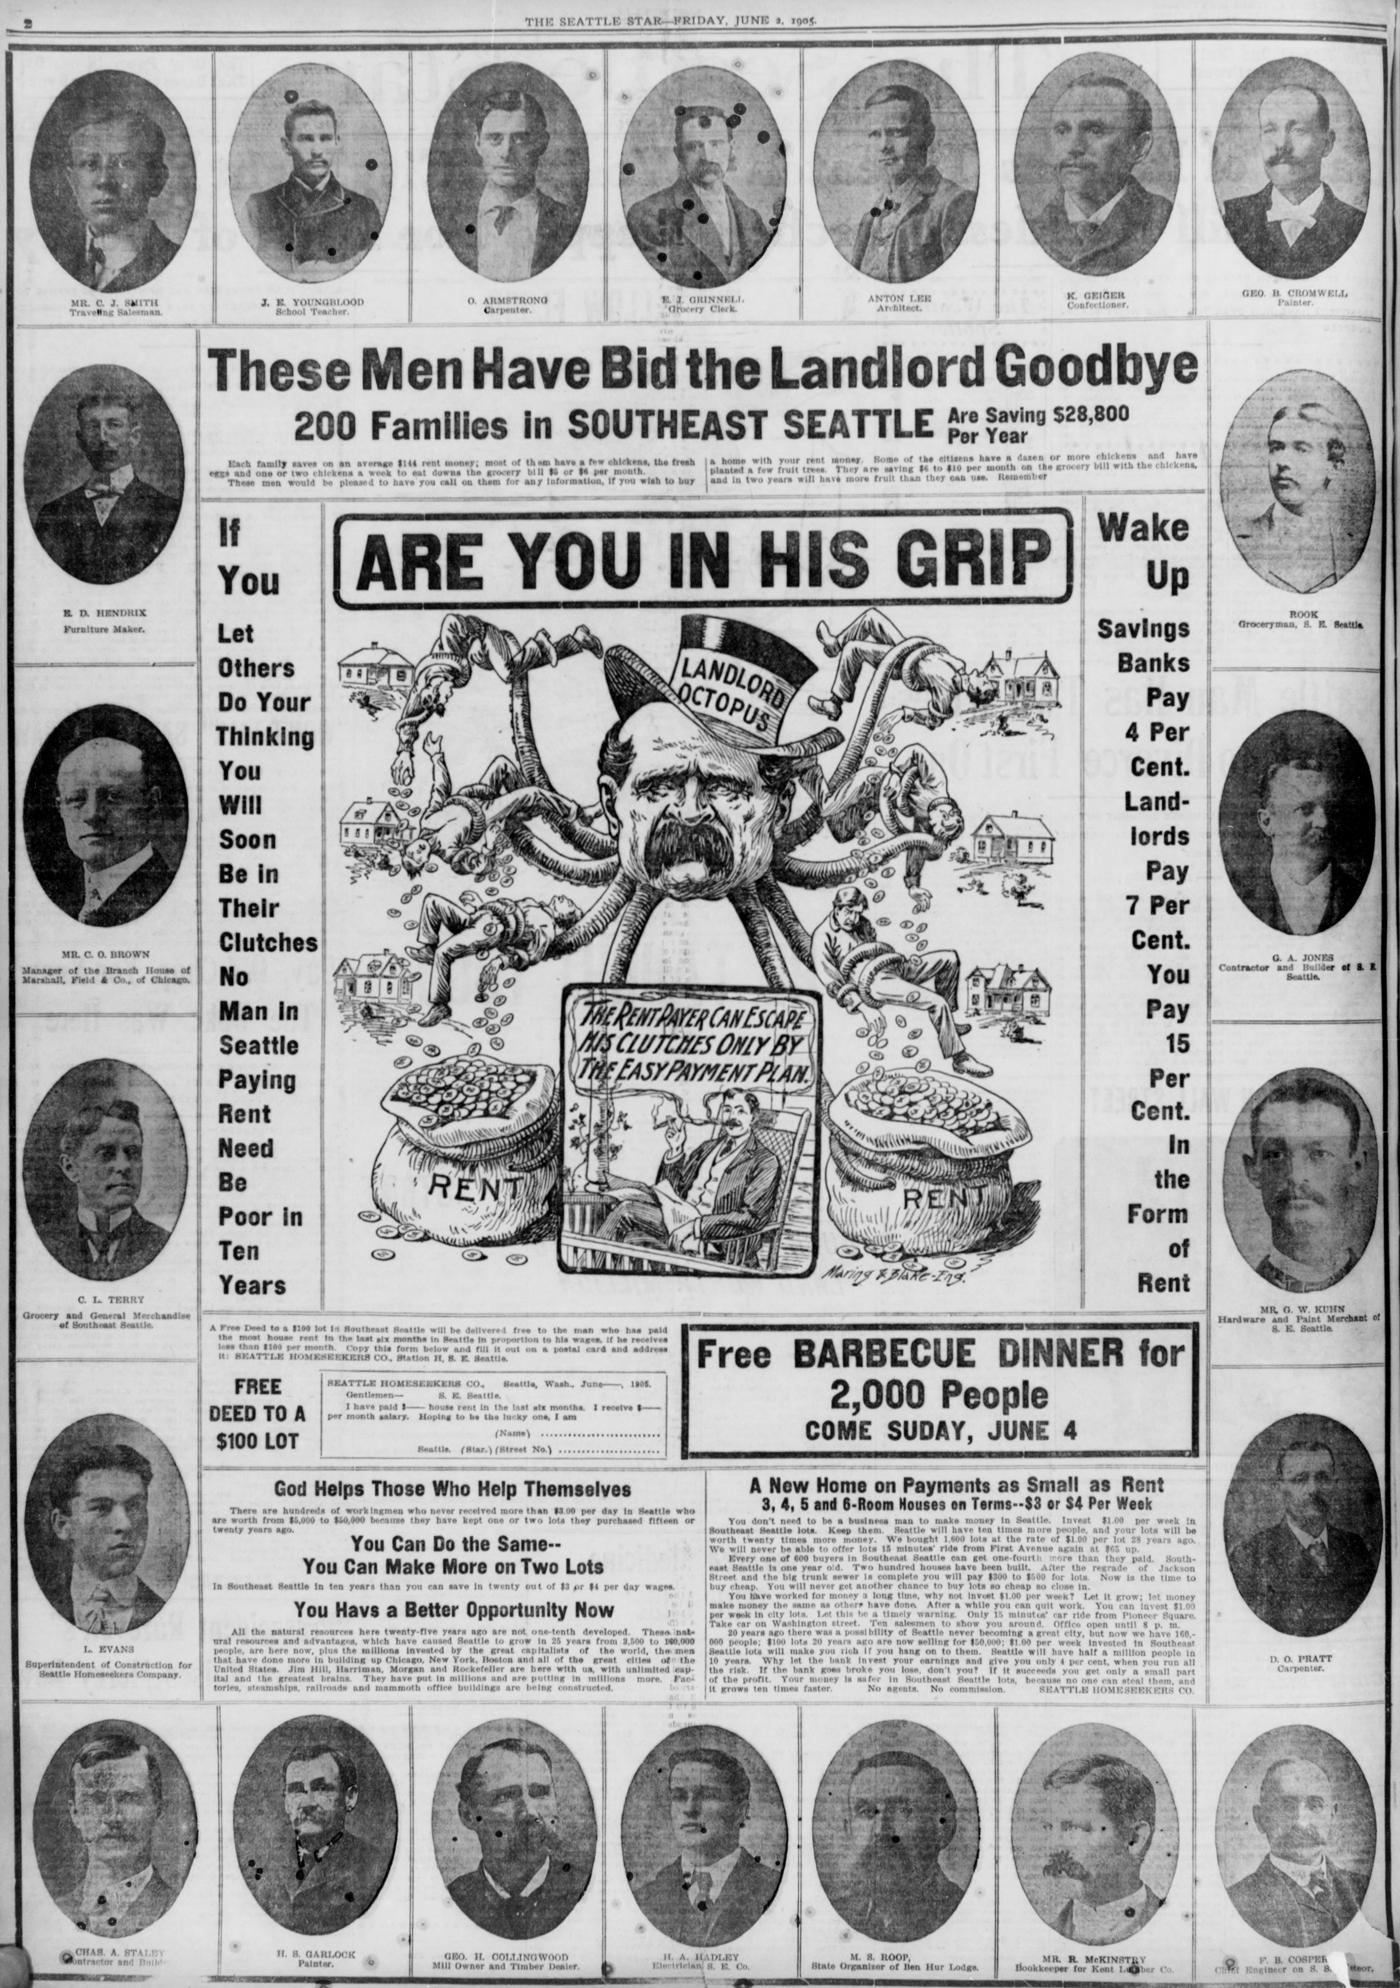
ARE YOU IN THE GRIP OF THE LANDLORD OCTOPUS?!?

NWMLS: Record Low Inventory As Home Prices Flatten
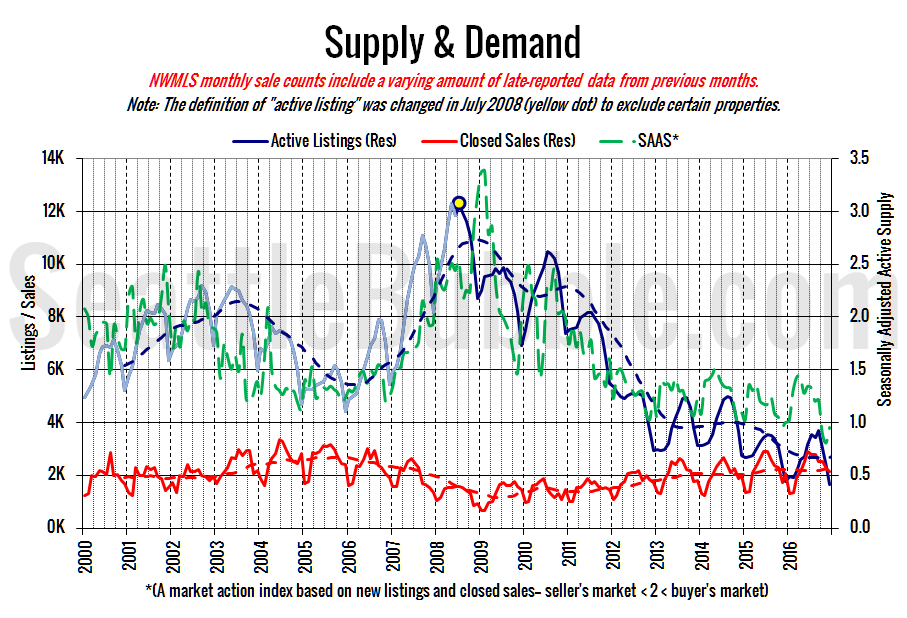
December market stats were published by the NWMLS yesterday afternoon.
Basically another terrible month for home buyers. Inventory hit an all-time low, but despite that, sales were actually up from a year ago. The one good note is that prices have been flat for the last three months. Small comfort.
December Stats Preview: New Record Lows For Inventory
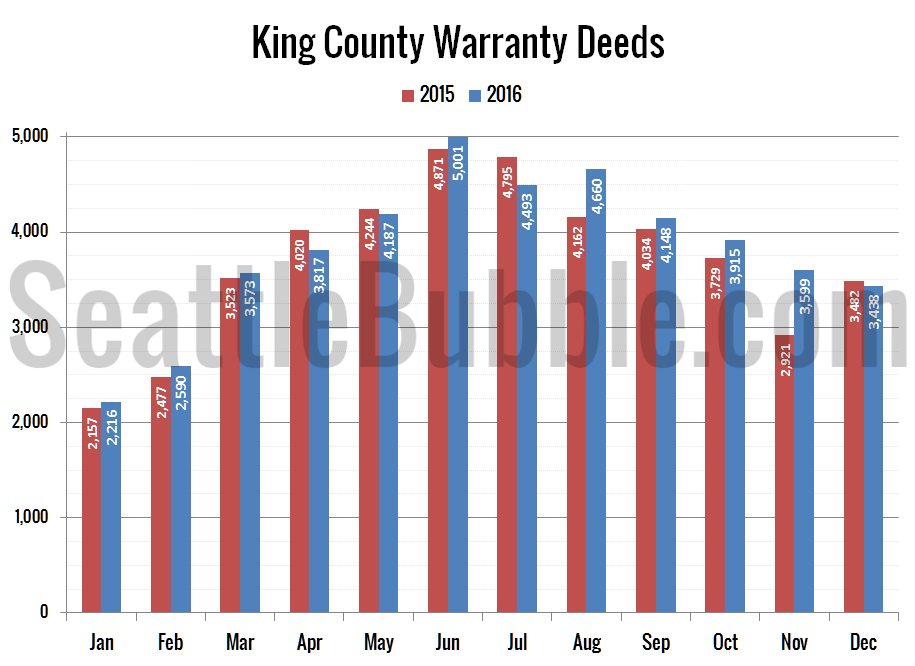
December is done, so let’s take a look at the local housing market stats for the month. Short story: Record-low inventory and sales falling just slightly.
Sales came in weaker than last year, and also fell from November to December. Listings dropped to new all-time lows in both counties. Foreclosures are still at their historic lows.