Skip to content

Seattle Bubble

local real estate news, statistics, and commentary without the sales spin.

Menu
  • Home
  • About
  • Contact
  • Reference
  • Speaking
Menu

Tag: Statistics

September Stats Preview: Sales drop over 25 percent from 2017 as listings continue to pile up

Posted on October 1, 2018October 1, 2018 by The Tim

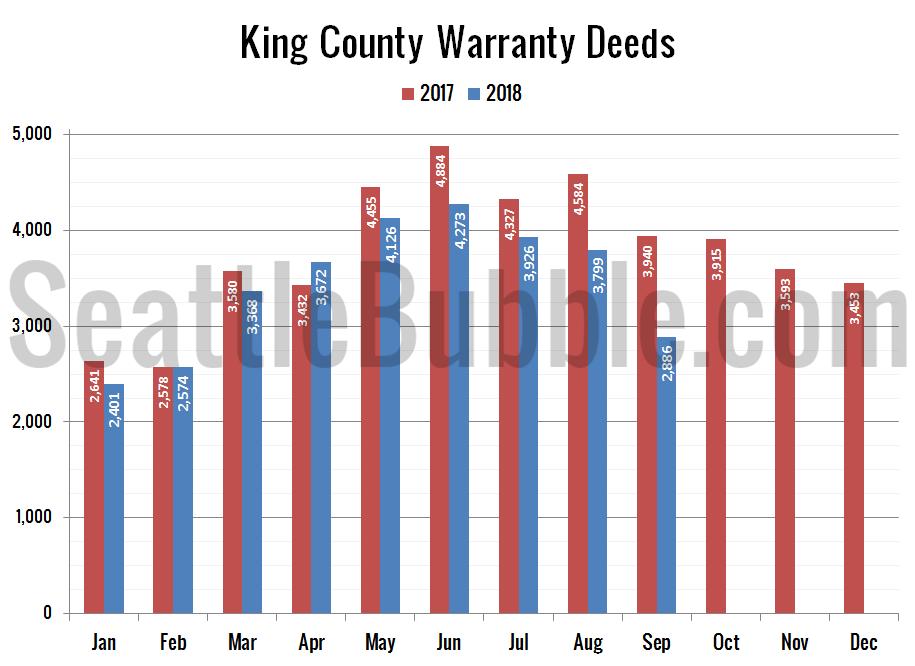
Home sales volume was at its lowest September level in six years for both King and Snohomish County last month, dipping over 22 percent from a year ago. As a result, the number of homes on the market hit its highest point since early 2012. Foreclosures are still at all-time lows…

Share:

  • Twitter
  • LinkedIn
  • Facebook
  • Reddit
  • Pinterest
  • Email

Case-Shiller Tiers: Low tier home prices edged up in July as mid and high tiers slipped

Posted on September 26, 2018October 1, 2018 by The Tim

Let’s check out the three price tiers for the Seattle area, as measured by Case-Shiller. Remember, Case-Shiller’s “Seattle” data is based on single-family home repeat sales in King, Pierce, and Snohomish counties.

Only the low tier was up month-over-month once more in July. The middle tier and high tier both fell…

Share:

  • Twitter
  • LinkedIn
  • Facebook
  • Reddit
  • Pinterest
  • Email

Case-Shiller: Seattle was the only market to see price declines between June and July

Posted on September 25, 2018October 1, 2018 by The Tim

Let’s have a look at the latest data from the Case-Shiller Home Price Index. According to July data that was released today, Seattle-area home prices were:

Down less than 0.1 percent June to July
Up 12.1 percent YOY.
Up 34.7 percent from the July 2007 peak

Last year at this time prices were up 0.7 percent month-over-month and year-over-year prices were up 13.5 percent…

Share:

  • Twitter
  • LinkedIn
  • Facebook
  • Reddit
  • Pinterest
  • Email

Expensive parts of King County are seeing bigger dips in sales and prices

Posted on September 24, 2018October 1, 2018 by The Tim

It’s been six months since we took a look at the in-county breakdown data from the NWMLS to see how the sales mix shifted around the county. I like to keep an eye on this not only to see how individual neighborhoods are doing but also to see how the sales mix shift affects the overall county-wide median price.
…
The number of sales in all three tiers has been decreasing month-over-month for the past two months. Month-over-month sales were down five percent in the low tier, down ten percent in the middle tier, and down eight percent in the high tier…

Share:

  • Twitter
  • LinkedIn
  • Facebook
  • Reddit
  • Pinterest
  • Email

NWMLS: Prices retreat slightly as inventory continues to climb

Posted on August 7, 2018 by The Tim

July market stats were published by the NWMLS yesterday. The biggest news is still the climb in inventory, which is up 256 percent from the all-time low that was set back in December. If the current trend continues (a big “if”), it’s entirely possible that by the end of this year inventory will be at its highest point since 2011.

Share:

  • Twitter
  • LinkedIn
  • Facebook
  • Reddit
  • Pinterest
  • Email

Posts navigation

  • Previous
  • 1
  • …
  • 5
  • 6
  • 7
  • 8
  • 9
  • 10
  • 11
  • …
  • 134
  • Next

Tim’s Other Projects

Dispatches from the Multiverse

Tip Jar

Like what we're doing?

Drop us a tip!

Accounts

  • Log in
  • Entries feed
  • Comments feed
  • WordPress.org
©2024 Seattle Bubble | Built using WordPress and Responsive Blogily theme by Superb