Skip to content

Seattle Bubble

local real estate news, statistics, and commentary without the sales spin.

Menu
  • Home
  • About
  • Contact
  • Reference
  • Speaking
Menu

Tag: Tableau

Case-Shiller: Seattle home prices fell more than anywhere else between July and August.

Posted on October 30, 2018 by The Tim

Let’s have a look at the latest data from the Case-Shiller Home Price Index. According to July data that was released today, Seattle-area home prices were:

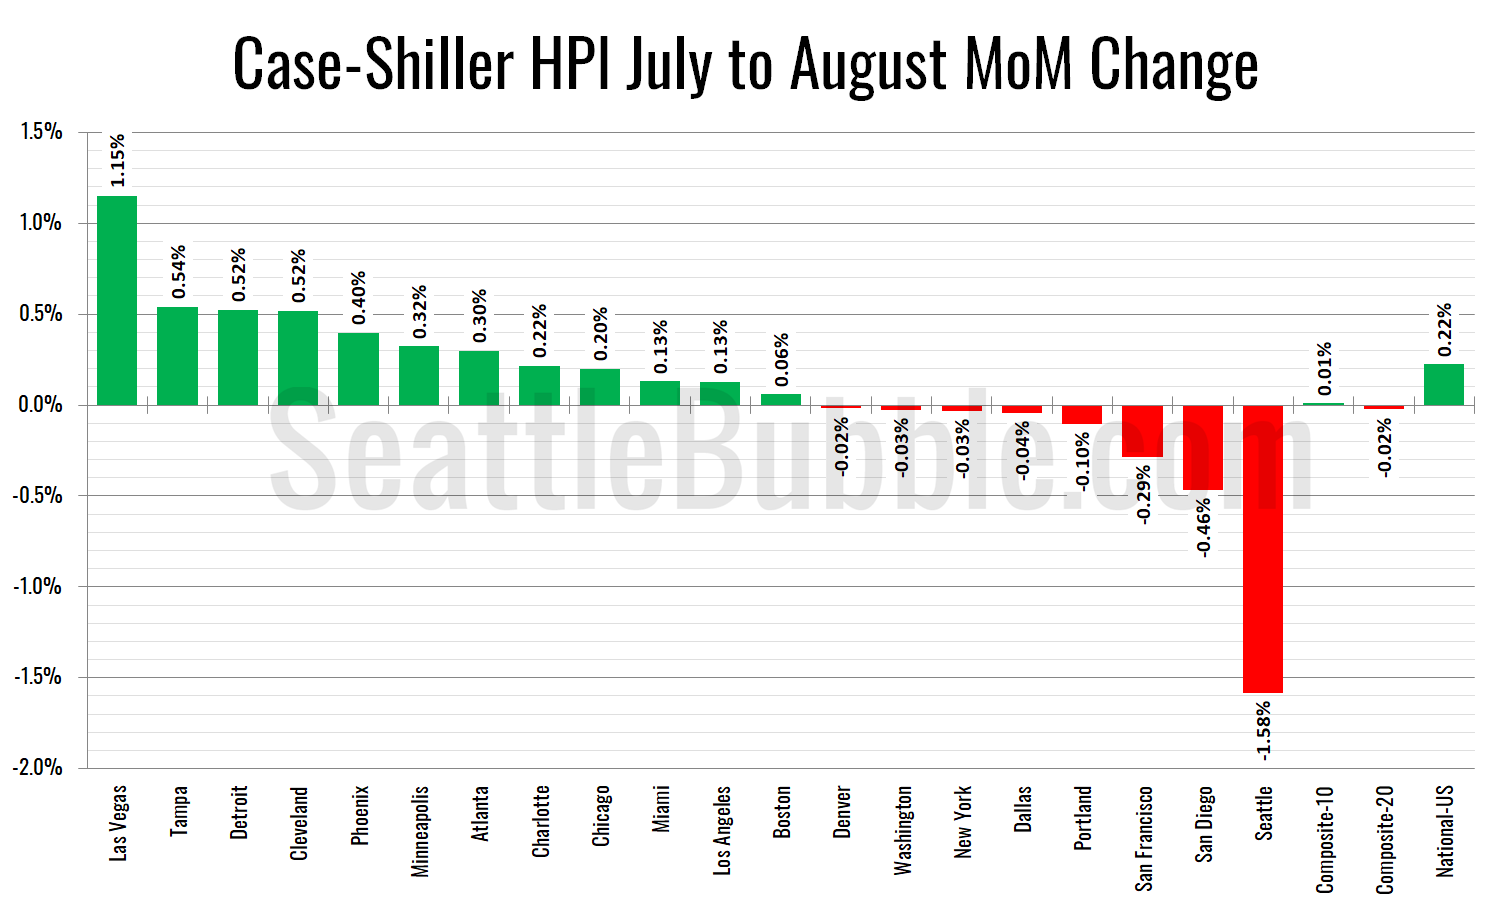
Down 1.6 percent July to August
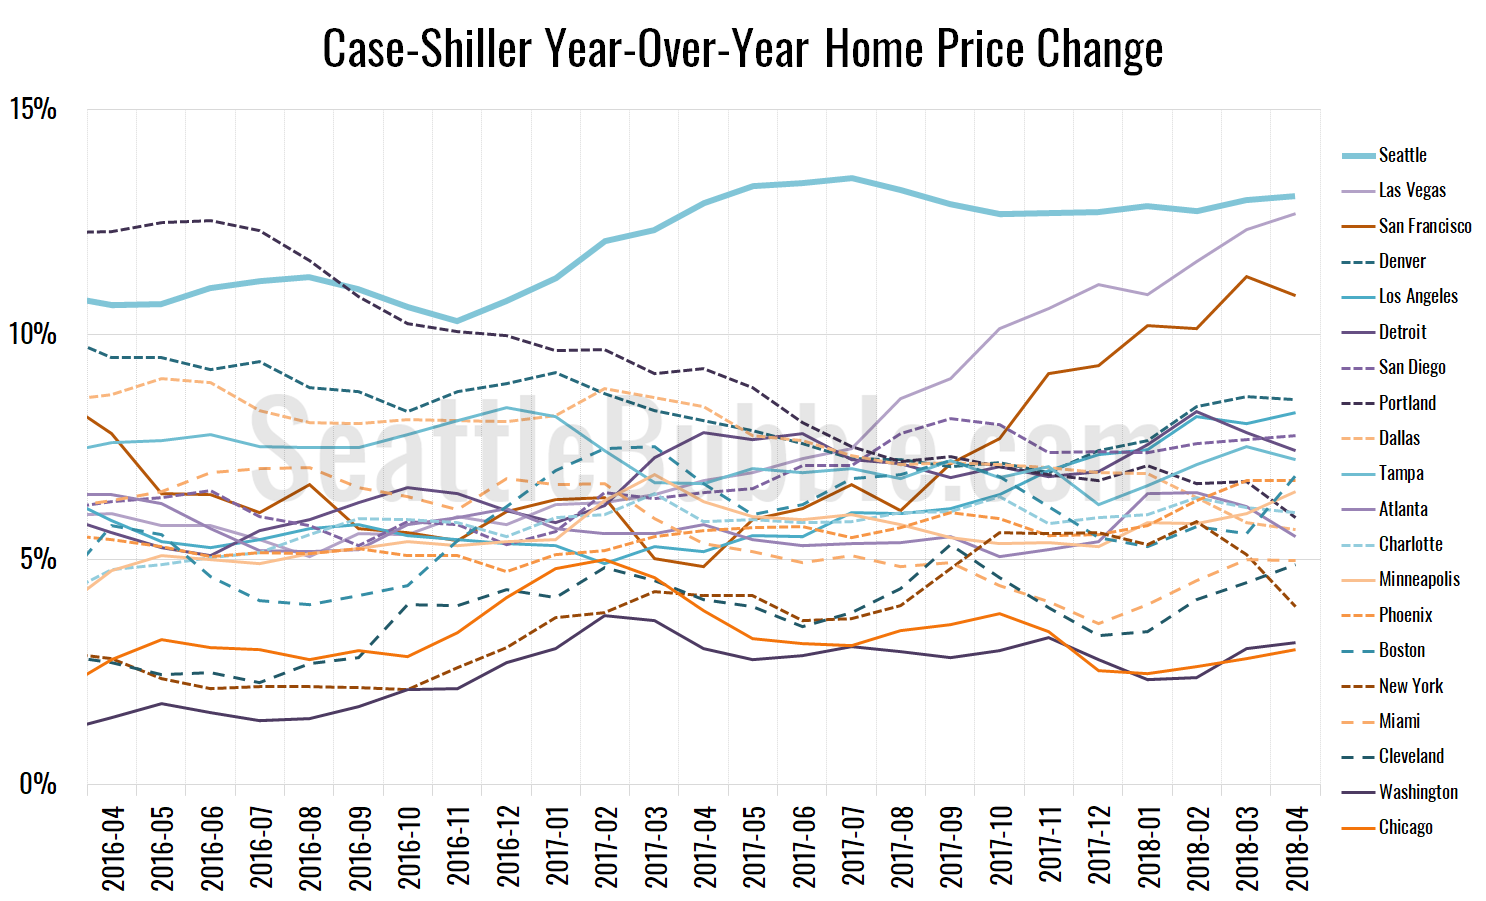
Up 9.6 percent YOY.
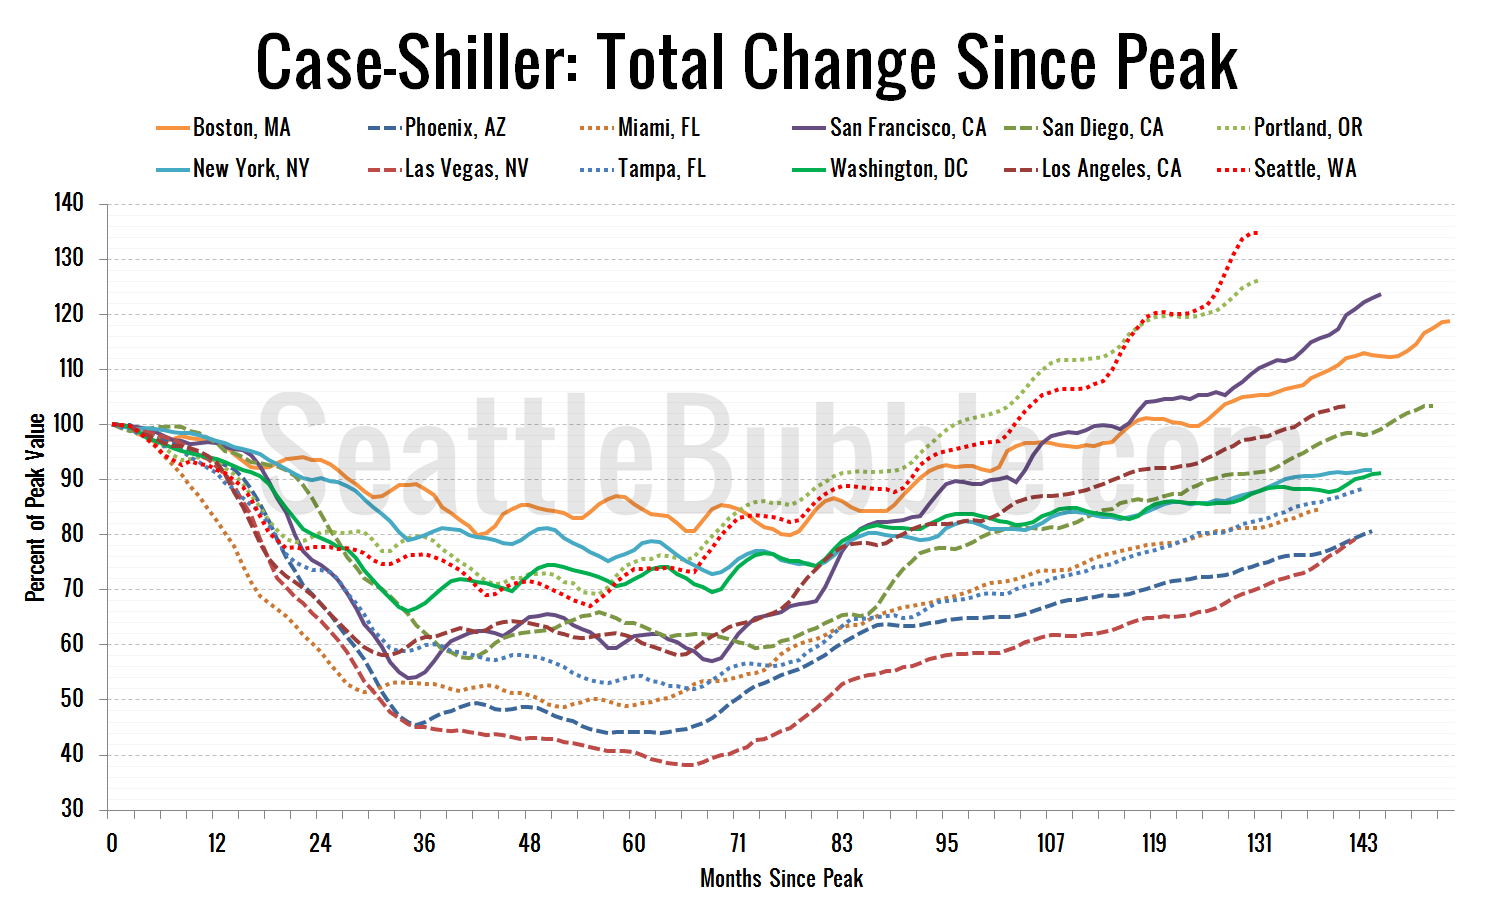
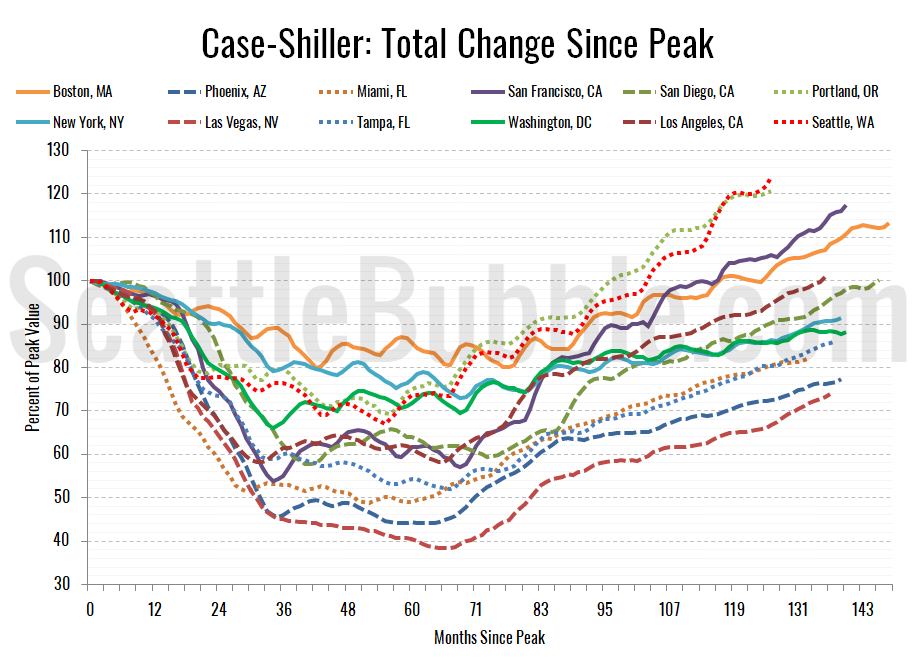
Up 31.9 percent from the July 2007 peak

Last year at this time prices were down 0.3 percent month-over-month and year-over-year prices were up 13.2 percent.

Share:

  • Twitter
  • LinkedIn
  • Facebook
  • Reddit
  • Pinterest
  • Email

Consumer Confidence blows past 2007 highs, approaches 2000 levels

Posted on September 27, 2018October 1, 2018 by The Tim

Before the month is over, let’s check in in on the latest data from the Consumer Confidence Index.

The overall Consumer Confidence Index currently sits at 138.4, up three percent in a month and up fifteen percent from a year ago…

Share:

  • Twitter
  • LinkedIn
  • Facebook
  • Reddit
  • Pinterest
  • Email

Case-Shiller: Seattle was the only market to see price declines between June and July

Posted on September 25, 2018October 1, 2018 by The Tim

Let’s have a look at the latest data from the Case-Shiller Home Price Index. According to July data that was released today, Seattle-area home prices were:

Down less than 0.1 percent June to July
Up 12.1 percent YOY.
Up 34.7 percent from the July 2007 peak

Last year at this time prices were up 0.7 percent month-over-month and year-over-year prices were up 13.5 percent…

Share:

  • Twitter
  • LinkedIn
  • Facebook
  • Reddit
  • Pinterest
  • Email

Case-Shiller: Seattle’s streak on top continues…

Posted on July 2, 2018July 2, 2018 by The Tim

Let’s have a look at the latest data from the Case-Shiller Home Price Index. According to April data that was released last week, Seattle-area home prices were:

Up 2.7 percent March to April
Up 13.1 percent year-over-year.
Up 30.8 percent from the July 2007 peak

Over the same period last year prices were up 2.6 percent month-over-month and year-over-year prices were up 12.9 percent.

Seattle still leads the nation in both year-over-year and month-over-month home price growth. Seattle has had the highest year-over-year price growth since September 2016. The only other metro areas with double-digit price growth from a year earlier in April were Las Vegas at 12.7 percent and San Francisco at 10.9 percent.

Share:

  • Twitter
  • LinkedIn
  • Facebook
  • Reddit
  • Pinterest
  • Email

Case-Shiller: Seattle home prices rising fastest in the nation

Posted on April 24, 2018 by The Tim

Let’s have a look at the latest data from the Case-Shiller Home Price Index. According to February data that was released this morning, Seattle-area home prices were:

Up 1.7 percent January to February
Up 12.7 percent year-over-year.
Up 23.9 percent from the July 2007 peak

Over the same period last year prices were up 1.8 percent month-over-month and year-over-year prices were up 12.1 percent.

Seattle leads the nation in both year-over-year and month-over-month home price growth. The only other metro areas with double-digit price growth from a year earlier are Las Vegas at 11.6 percent and San Francisco at 10.1 percent.

Share:

  • Twitter
  • LinkedIn
  • Facebook
  • Reddit
  • Pinterest
  • Email

Posts navigation

  • Previous
  • 1
  • 2
  • 3
  • 4
  • 5
  • …
  • 46
  • Next

Tim’s Other Projects

Dispatches from the Multiverse

Tip Jar

Like what we're doing?

Drop us a tip!

Accounts

  • Log in
  • Entries feed
  • Comments feed
  • WordPress.org
©2024 Seattle Bubble | Built using WordPress and Responsive Blogily theme by Superb