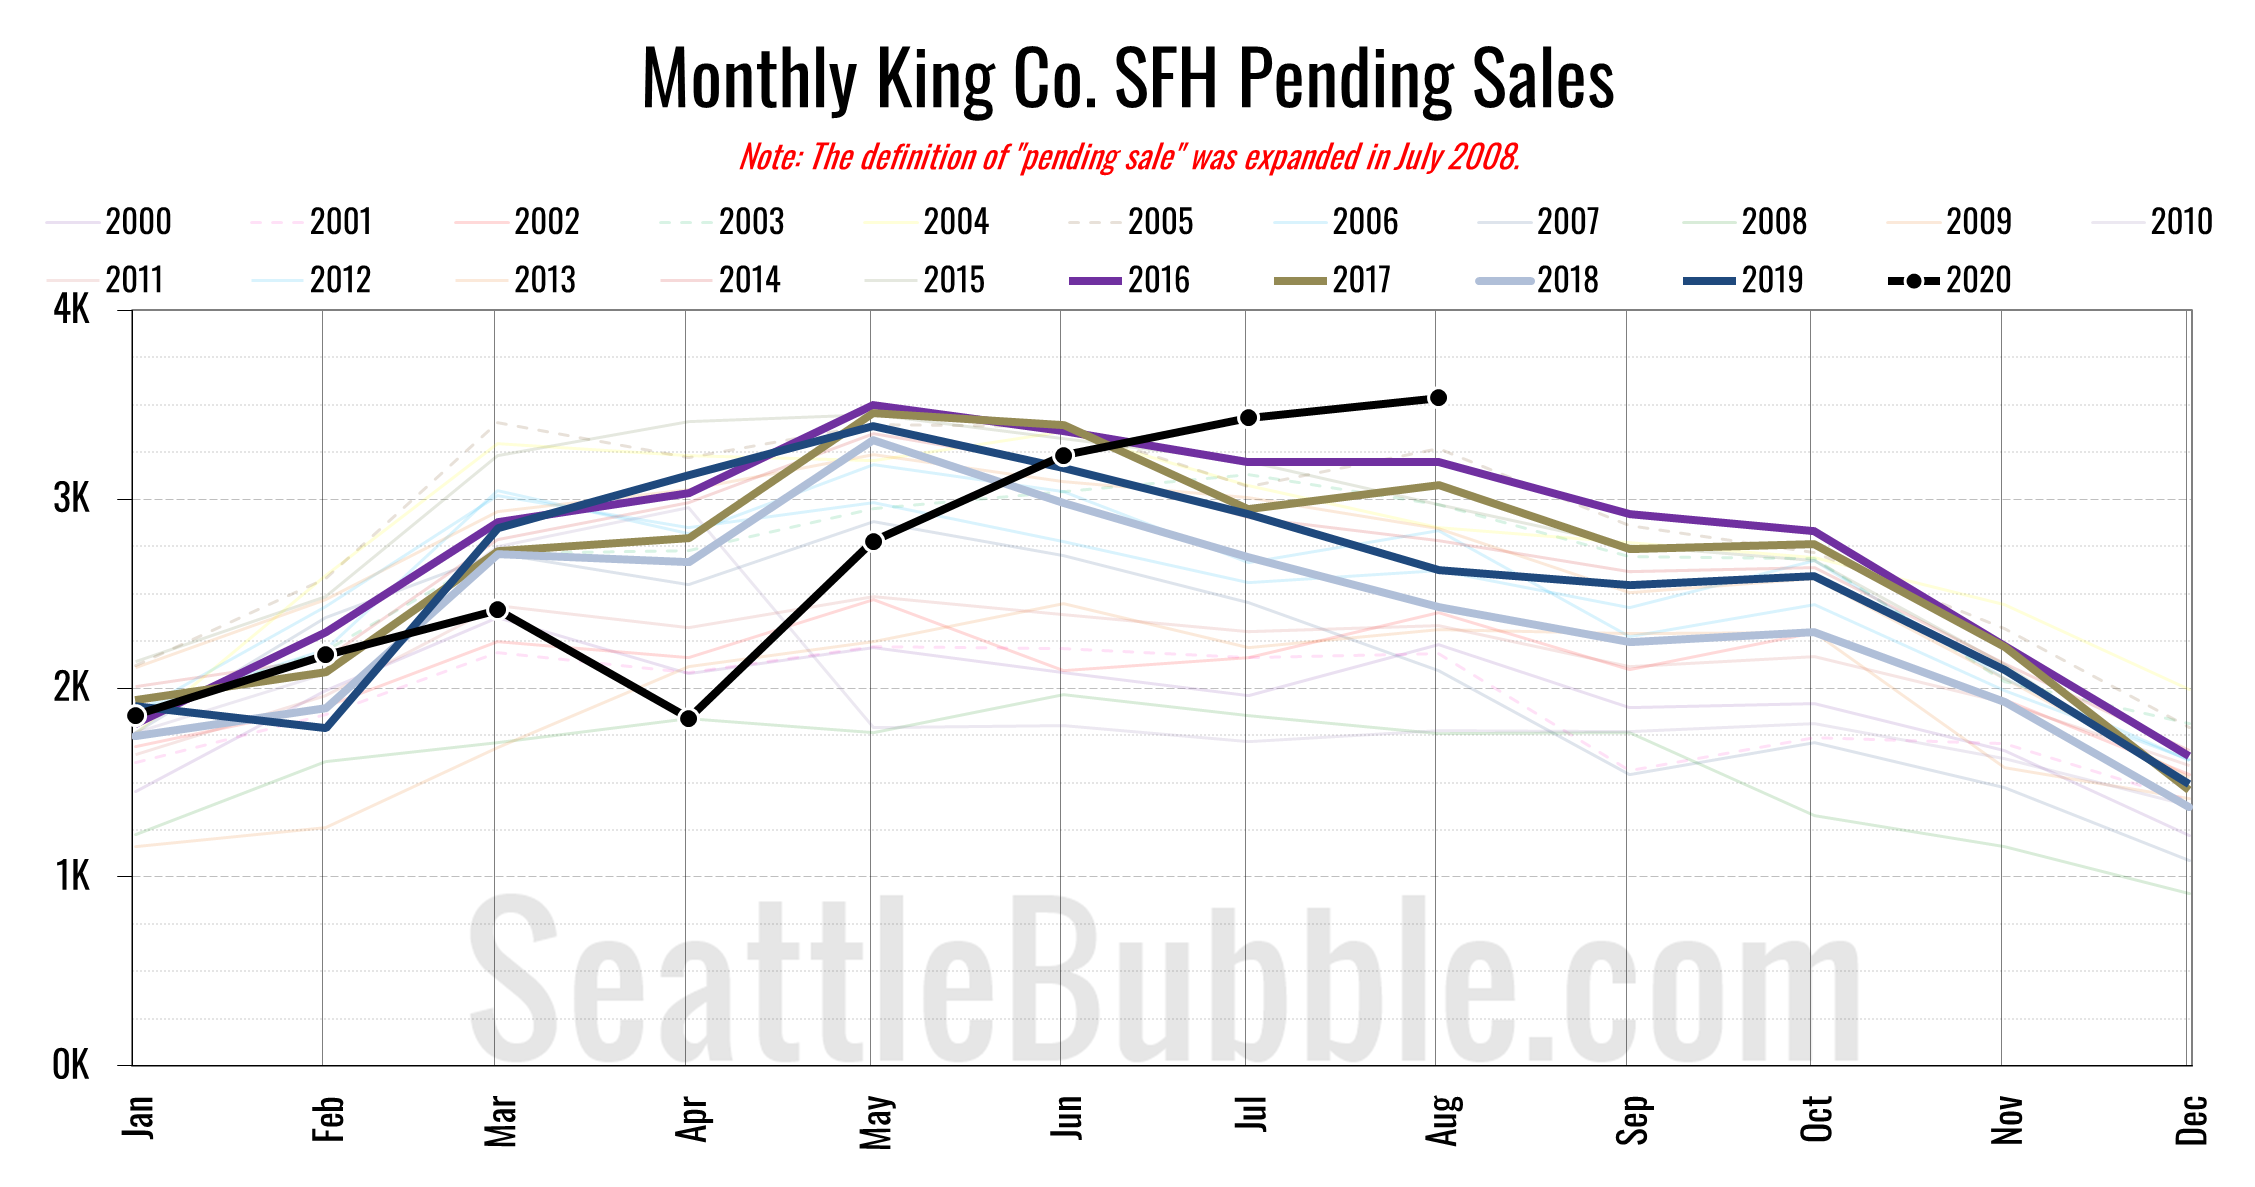
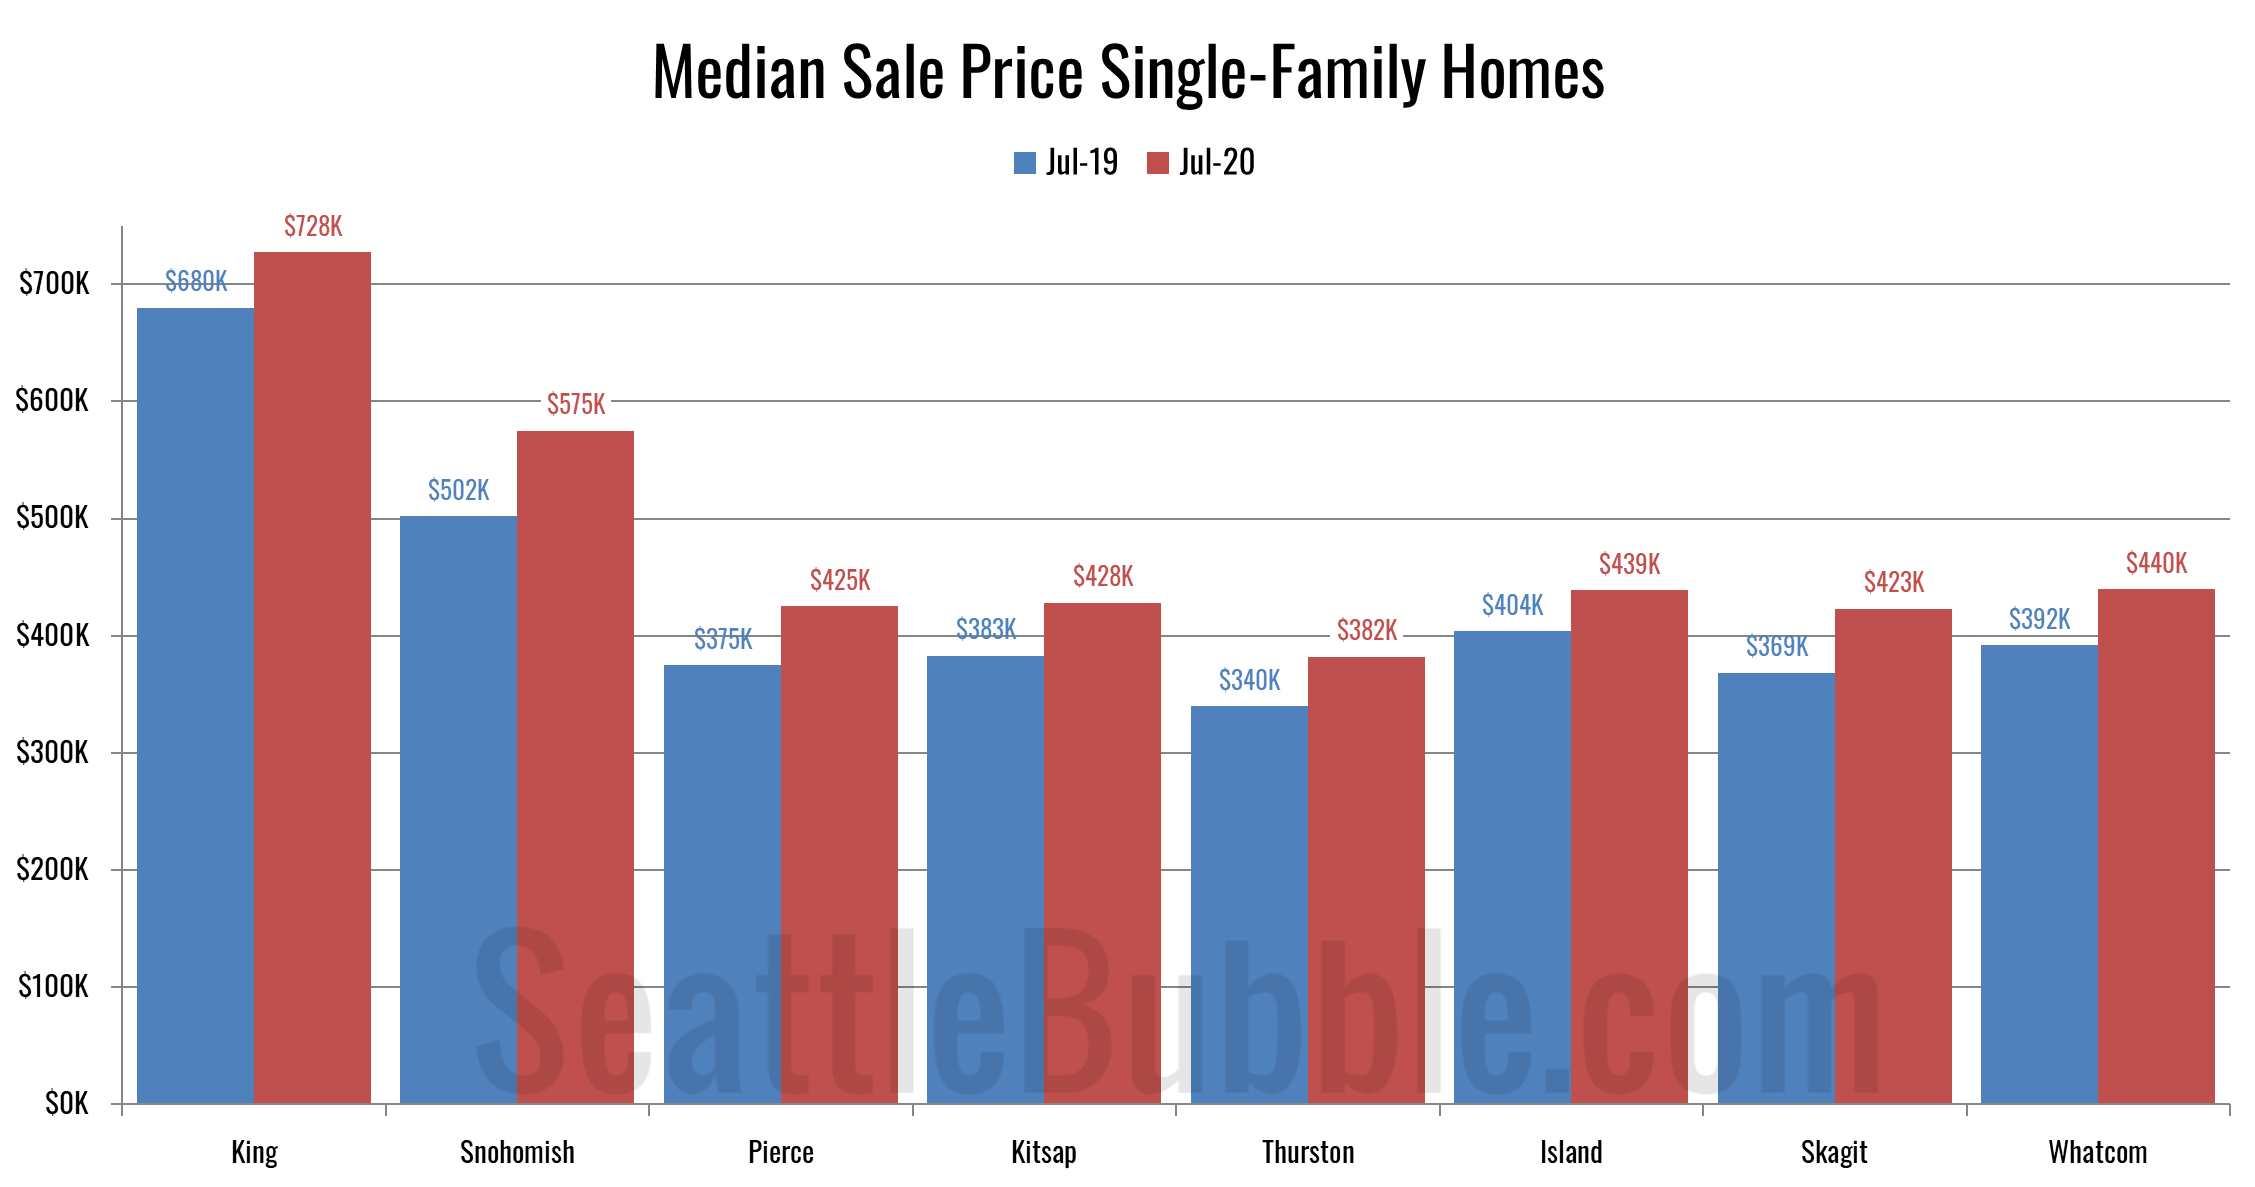
Seattle Bubble

News & discussion about real estate & the housing bubble in the Seattle area.

Seattle Bubble - News & discussion about real estate & the housing bubble in the Seattle area.
The latest from The Naked Loon: Bizarre Weather System to Slam Washington this Winter

Seattle PI: Washington home sales drop more than anywhere else in the nation

Posted by Jonness on November 20th, 2008 at 4:00 PM · 30 Comments

Editor’s Note: I’d like to welcome new contributor Jonness to Seattle Bubble. He maintains the excellent set of tools at HousingCorrection.com and has provided an interesting analysis of housing data in his comments. - The Tim


SeattleAn article in the Seattle P-I indicates that our home sales slowed more than anywhere else in the nation.

Sales of existing houses dropped more in Washington than anywhere else in the nation last quarter, compared with a year earlier, according to a new report. King County’s median sale price also dropped roughly 10 percent from a year earlier.

The state’s sales were down 36 percent from the third quarter of 2007, the National Association of Realtors reported. The next-largest annual drops were in Vermont and Delaware, where sales fell 33 percent.

A big reason why Washington’s annual drop is larger than other states’ is that its decline started later, meaning other areas had much slower markets a year ago.

According to Global Insight’s analysis, Washington is still overvalued, while bubble states California, Nevada, and Florida have largely corrected. It looks like Washington real estate has some fat left to trim in order to catch up with the rest of the nation.

(Aubrey Cohen, Seattle P-I, 11.19.2008)

→ 30 CommentsCategories: News
Tags: , , ,

Update: Boom and Bust Cycles Across Markets

Posted by deejayoh on November 20th, 2008 at 9:28 AM · 15 Comments

Back in July I posted a comparison of the total percentage gain during the boom years to the total percentage drop from peak to date across a bunch of markets, to see if I could establish a clear relationship or correlation between the two. I wanted to give a quick update on this analysis.

As a reminder, I based the gain/loss percentages on Case-Shiller data for May and August; and for the purposes of this comparison, I used the following definitions:

  • “Boom” returns are the total appreciation between 09/2001 (based on the oft cited relationship between the Fed taking down short term lending rates and the housing boom) and the peak for each market.
  • “Bust” returns are the total decline from peak to the latest reported numbers.

Boom vs. Bust update August 2008

Couple of things I noticed in this updated version of the analysis:

  • Overall, the slope of the line got steeper - meaning that the ratio of “bust” to “boom” increased. Based on what we are seeing in the super-bubbly markets (SF, San Diego, Phx, LA, Miami) I would expect this phenomenon will continue.
  • The “fit” of the line also got better - meaning markets generally moved closer to the line
  • Of the markets identified as “outliers” in the earlier analysis (Seattle, Portland, New York, Detroit), all but Detroit moved in the direction expected.

→ 15 CommentsCategories: Features · Statistics
Tags: , ,

Seattle Times: JPM to Cut ~70% of WaMu HQ Employees

Posted by The Tim on November 19th, 2008 at 10:20 AM · 79 Comments

WaMu Towers by S x 2
Photo by Flickr user S x 2

According to today’s Seattle Times, JPMorgan Chase plans to cut around 70% of WaMu’s Seattle-area employees.

JPMorgan is handing out layoff notices now and is expected to finish making decisions about all of WaMu’s 43,200 employees nationwide by Dec. 1.

As many as 3,000 of WaMu’s 4,200 workers in Seattle could lose their jobs, according to current and recently departed WaMu executives who spoke on condition of anonymity.

“It’s pretty dire for Seattle,” said one former high-ranking executive.

The layoffs will leave gaping holes in downtown Seattle’s commercial real-estate market, where WaMu occupies more office space than any other company.

With no other major banks headquartered here in Seattle, I wonder where all these newly jobless banking professionals will be able to find work.

I’d like to extend my condolences to those that are affected by these cuts, which are likely to include some of my friends. Sure, we were right about the housing bubble, but nobody likes to see people lose their jobs.

Best of luck to the soon to be former WaMulians.

(Melissa Allison & Eric Pryne, Seattle Times, 11.19.2008)

→ 79 CommentsCategories: News
Tags: , , , ,

Findwell - Get full service at 1/2 the commission.

Washington Banks Hit With More Bad Loans

Posted by The Tim on November 18th, 2008 at 1:35 PM · 10 Comments

Kirsten Grind had an interesting piece about local banks in the Puget Sound Business Journal last Friday: Bad loans rising at Washington banks

Bad loans are up dramatically at Washington state banks, surpassing the national average and reaching levels that local banking experts say are unprecedented.

Washington banks historically have seen lower levels of problem loans than their counterparts across the country. But their heavy construction lending has hit them hard in the wake of the housing slowdown, said Brad Williamson, director of the Division of Banks at the Washington State Department of Financial Institutions, which regulates state banks.

How bad is it? Since the height of the housing market in the middle of 2006, Washington state’s 97 banks — both publicly traded and private — have seen their problem loans jump from an average of 0.42 percent to 2.71 percent of all assets, according to the most recent data available from the Federal Deposit Insurance Corp. That compares with a national average of 1.89 percent.

As a counterweight to bad loans, regional banks are bulking up with more capital, which acts as a buffer to the problem loans. And most publicly traded banks across the Puget Sound region are considered well capitalized.

But a well-capitalized bank can still fail, and several already have. Both Washington Mutual and IndyMac, of California, were well-capitalized by federal regulatory standards in their last quarterly reports before their historic failures this year.

The basic message seems to be that local banks are in slightly more pain than the national average in terms of bad loans, but that bad loans aren’t a particularly useful predictor of bank failures.

I was surprised to read that local banks actually have a higher percentage of bad loans than the national average. That would seem to fly somewhat in the face of the “Seattle is special” mantra of many local economists.

(Kirsten Grind, Puget Sound Business Journal, 11.14.2008)

→ 10 CommentsCategories: News
Tags: , , , ,

Are Reluctant Title Insurers Hampering the Market?

Posted by The Tim on November 18th, 2008 at 10:49 AM · 19 Comments

I received the following in an email from a reader:

In August I found a brand new townhouse in a great location that is selling at about 5 or 10% below recent comps (and 15 to 25% off of what it would have gone for at peak). I still think I am going to end up underwater at some point in the next few years, but I can take the equity hit if I have to, and I don’t plan on selling (maybe not ever).

At the end of all of this, the builder can’t get title insurance. We were supposed to close last week, but the builder has been firmly rejected for title insurance twice—apparently this is happening to lots of builders. The rationale for rejecting him has been consistently that “title insurance companies have lost too much insuring builders already.”

In addition to being an example of the current aversion to risk everywhere, it is also another drag on actually getting the transactions closed. We want to buy, they want to sell, we’re one of the few with sufficient income and credit scores for the bank to want to lend to us, and the transaction is in peril because of title insurance.

Has anyone else experienced this problem? I haven’t heard anything in the major news outlets about a wave of title insurance problems killing closings.

If this is a widespread issue, it could certainly be yet another factor dragging the market down.

→ 19 CommentsCategories: News
Tags: ,

Puget Sound Counties October NWMLS Update

Posted by The Tim on November 17th, 2008 at 10:19 AM · 82 Comments

Let’s check in on the NWMLS statistics from around the sound.

Here’s where the YOY stats stand for each of the six counties as of October 2008:

King - Price: -11.7% | Listings: +2.7% | Sales: -22.4% | MOS: 8.3
Snohomish - Price: -10.8% | Listings: -6.0% | Sales: -28.0% | MOS: 10.9
Pierce - Price: -9.2% | Listings: -12.1% | Sales: -12.3% | MOS: 9.4
Kitsap - Price: -11.4% | Listings: -6.8% | Sales: -19.7% | MOS: 9.3
Thurston - Price: -0.3% | Listings: -7.5% | Sales: -20.9% | MOS: 7.7
Island - Price: -3.4% | Listings: +1.7% | Sales: -27.1% | MOS: 17.5
Skagit - Price: -0.6% | Listings: +2.0% | Sales: -48.1% | MOS: 16.2

These graphs only represent the market action since January 2006. If you want to see the long-term trends, feel free to download the spreadsheet (or in Excel 2003 format) that all of these graphs come from, and adjust the x-axis to your liking. Also included in the spreadsheet is data for Whatcom County, for anyone up north that might be interested.

First up, it’s raw median prices.

Puget Sound Median SFH Prices
Click to enlarge

Median prices actually increased month-to-month in Snohomish, Pierce, Thurston and Skagit counties, while declining in King, Kitsap, and Island. King’s drop was the largest, falling $23,000 in one month.

Here’s how each of the counties look compared to their peak:

King - Peak: July 2007 | Down 18.5%
Snohomish - Peak: March 2007 | Down 12.7%
Pierce - Peak: August 2007 | Down 14.6%
Kitsap - Peak: September 2007 | Down 17.3%
Thurston - Peak: July 2007 | Down 6.9%
Island - Peak: August 2007 | Down 20.0%
Skagit - Peak: June 2007 | Down 14.0%

Island County has taken the lead with the largest total drop right at 20%, with King not far behind at 18.5% Much in the same way that the Seattle area did not rise as much as other parts of the country, and will likely not fall as far, the outlying Seattle-area counties also did not rise as much, and are so far tending not to fall as much. Note that the spreadsheet also contains a “drop from peak” graph, similar to the one posted with the monthly Case-Shiller update.

[Read more →]

→ 82 CommentsCategories: Statistics
Tags: , , , , , , , , , ,