As we’re getting back into the swing of things, let’s check out the housing stats for the recently-completed month of August…
local real estate news, statistics, and commentary without the sales spin.
As we’re getting back into the swing of things, let’s check out the housing stats for the recently-completed month of August…
NWMLS stats for August are due any day now, probably later today, but let’s have a look at our “early” view on the August housing market stats for the Seattle area.
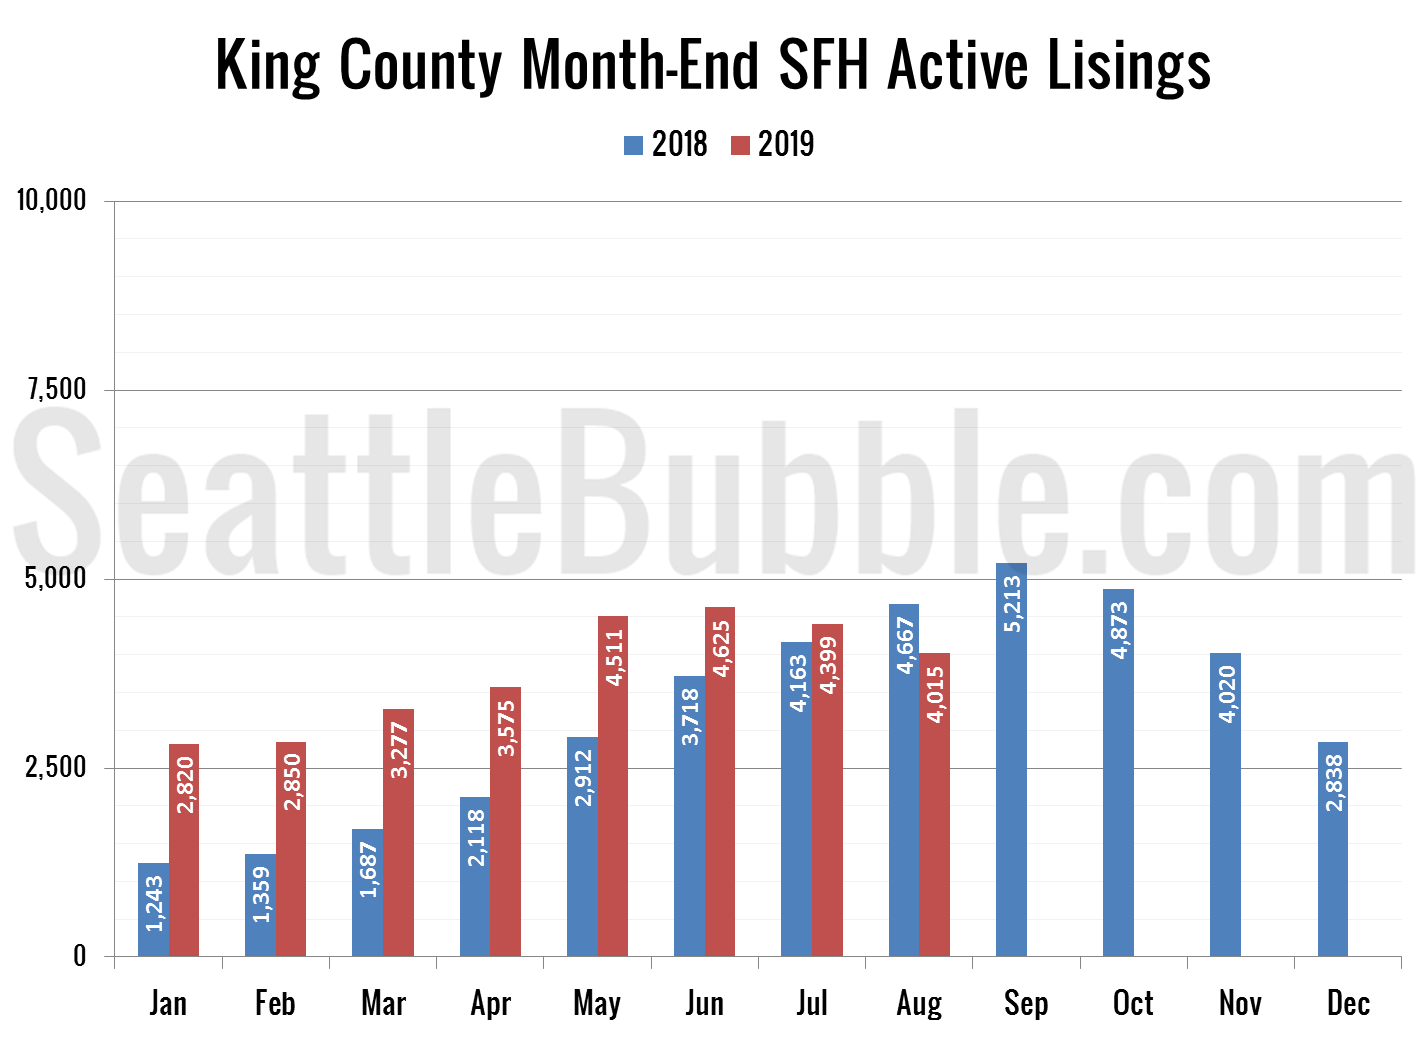
The biggest news: Active listings appear to be down considerably from a year ago. This is a big flip from earlier this year, when listings were way up, and definitely not great news for buyers.
This is the last post in today’s data catch-up marathon. I’ll also update a few more of the spreadsheets for members, and if the NWMLS posts their June data today I’ll try to get that up as well.
For now, let’s have a look at our “early” view on June stats.
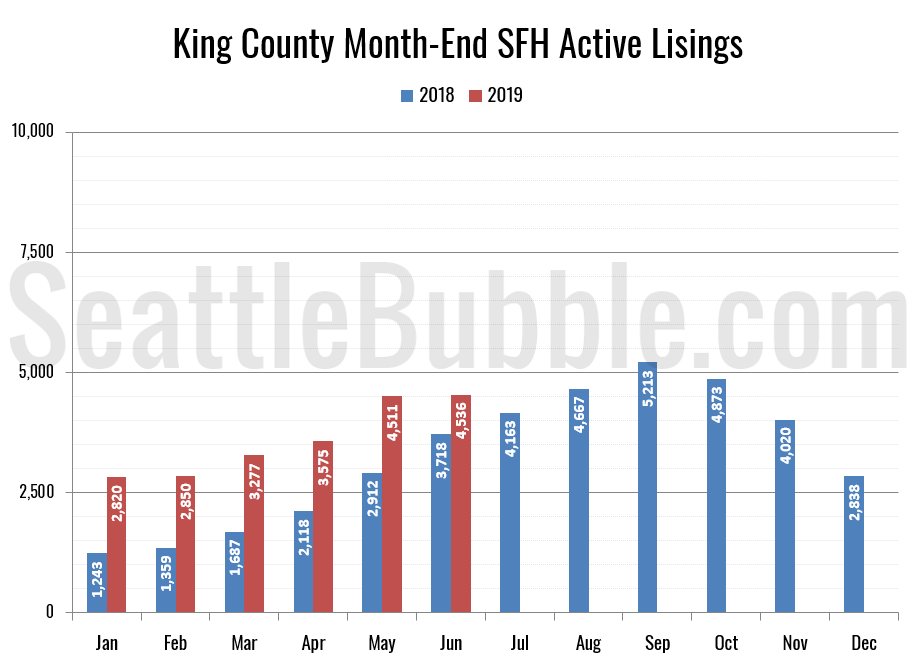
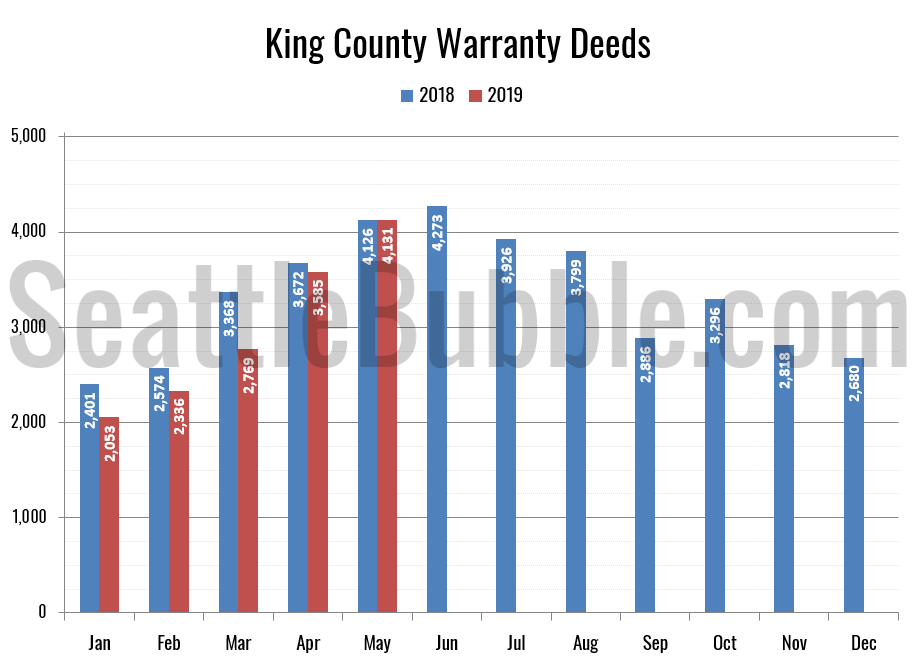
In summary: Listings are still up from a year ago, but not by as much as they have been. Sales are down, but only just a bit.
Remember, you can always get access to the Seattle Bubble spreadsheets by supporting my ongoing work as a member of Seattle Bubble. Hey look who it is. That Seattle Bubble guy. He’s not gone after all. Seriously though, everything is fine. Things just got a bit busy. Let’s have a look at the May stats,…
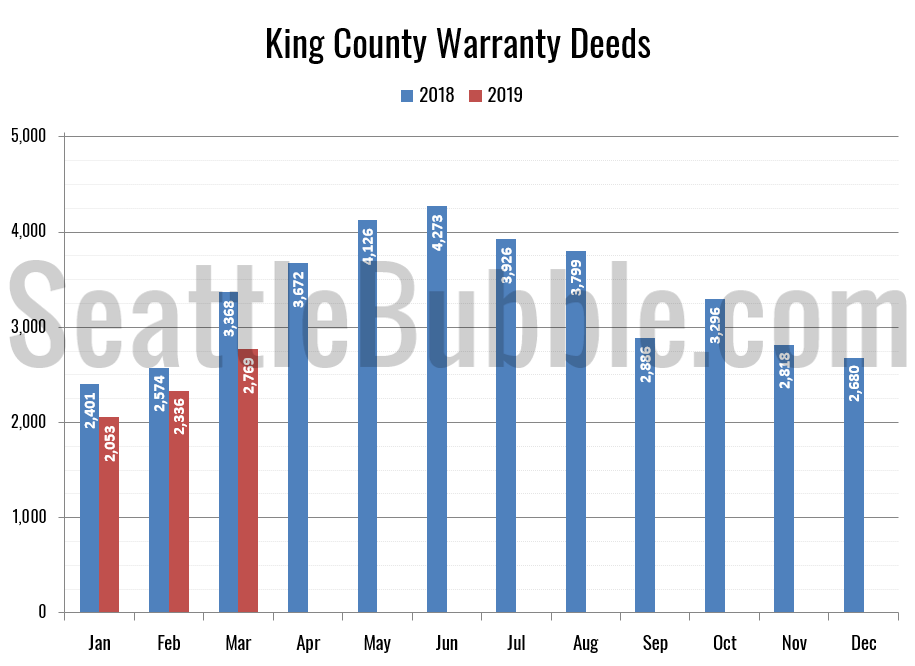
Let’s take a look at our early March housing stats.
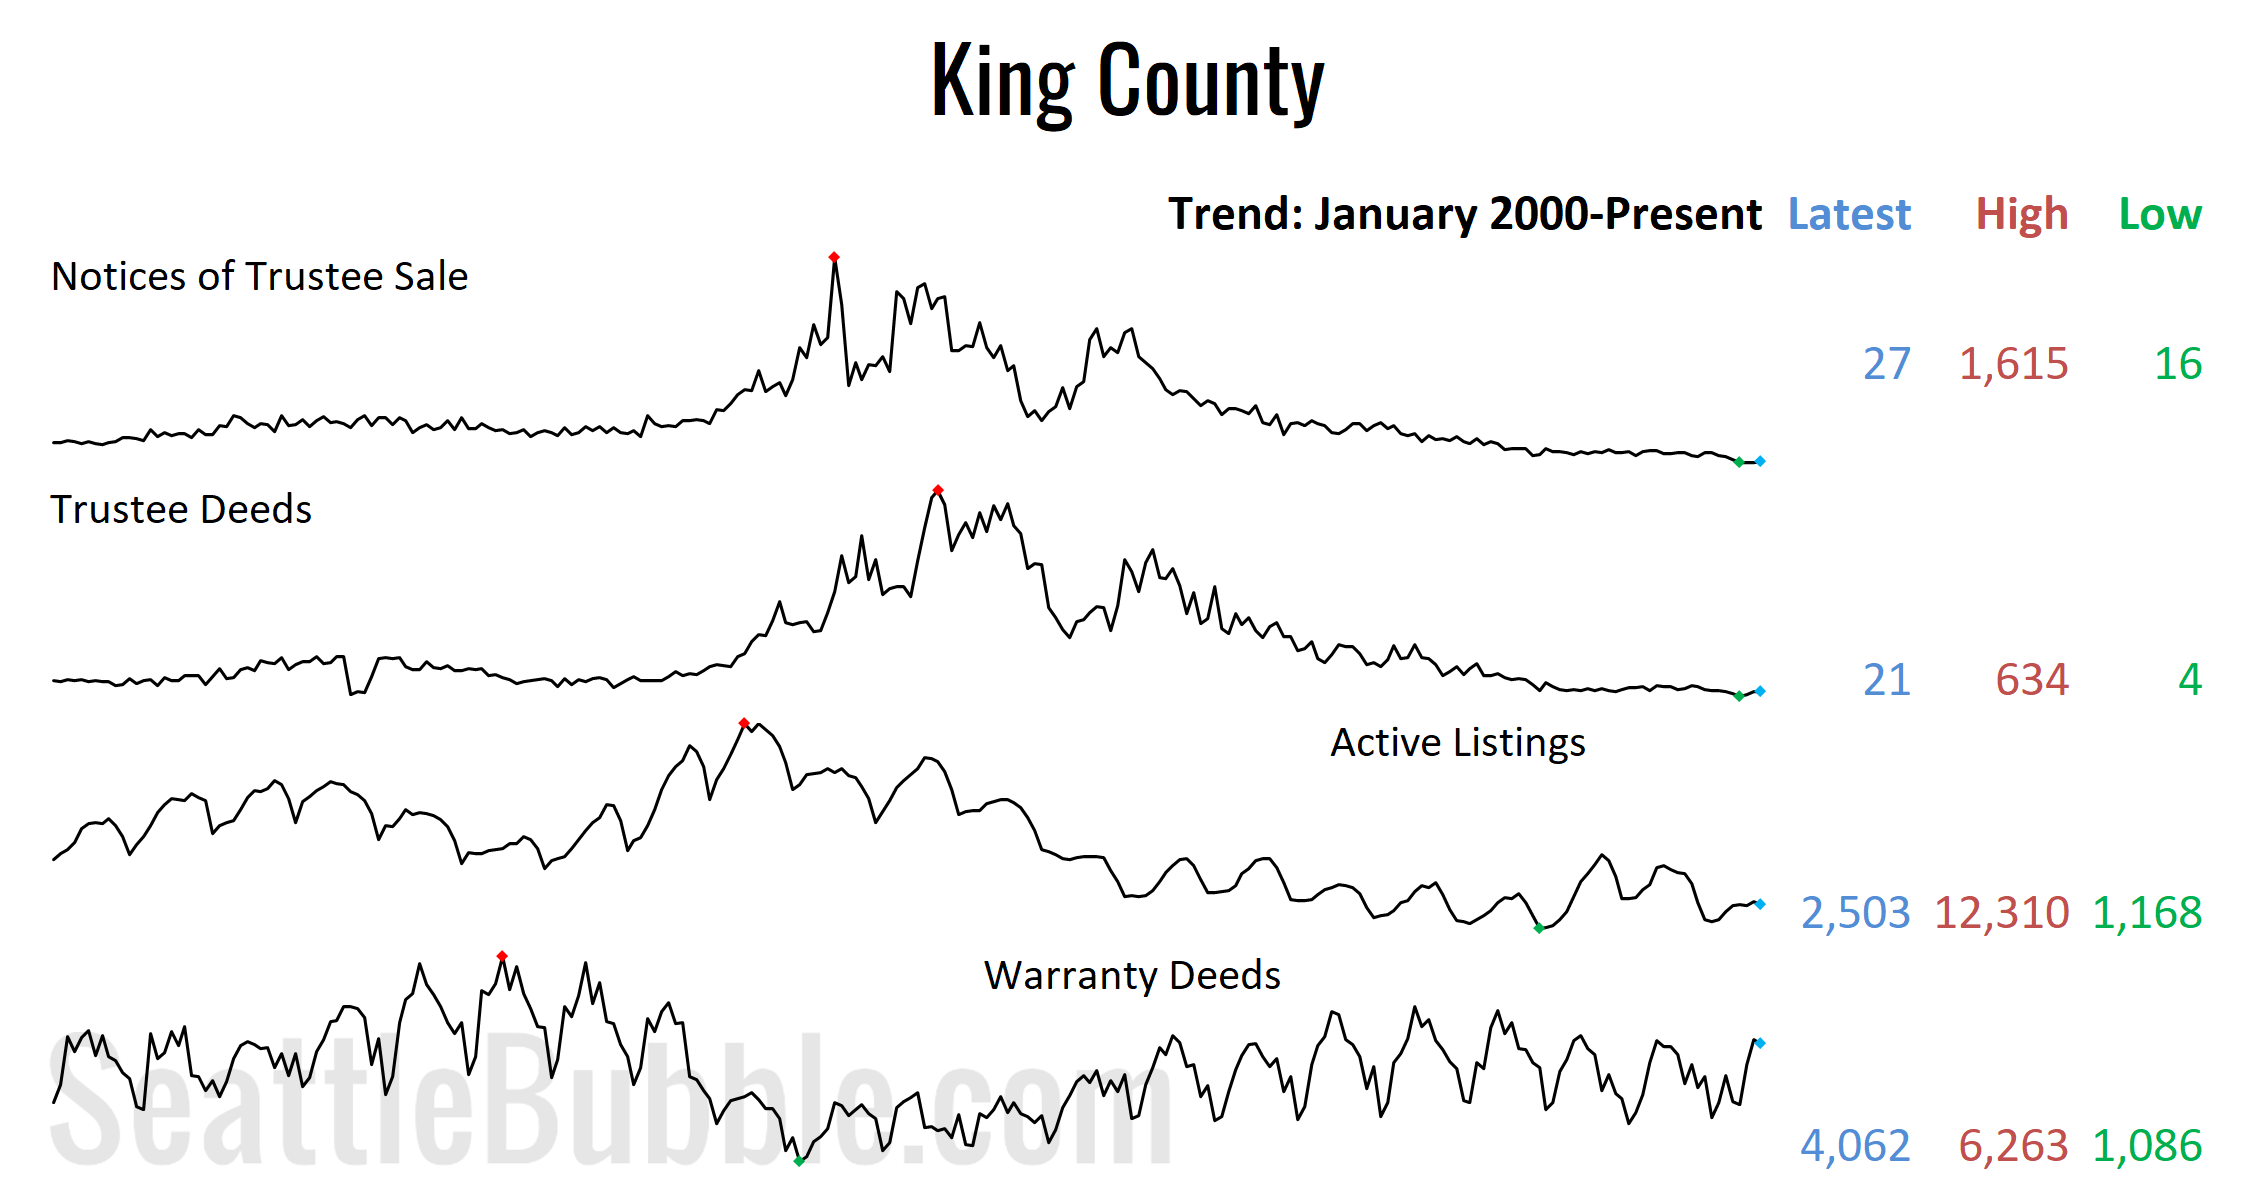
Overall the market is still moving in a direction favorable to buyers, but more slowly than it was late last year. By March of this year inventory is already at levels that it didn’t hit until May or June last year. Meanwhile, sales are still down from a year earlier. Foreclosures are still not really an issue at all right now…