Skip to content

Seattle Bubble

local real estate news, statistics, and commentary without the sales spin.

Menu
  • Home
  • About
  • Contact
  • Reference
  • Speaking
Menu

Category: Statistics

Statistics, number-based analysis, etc.

NWMLS: Inventory continues to climb as sales slow

Posted on October 4, 2018 by The Tim

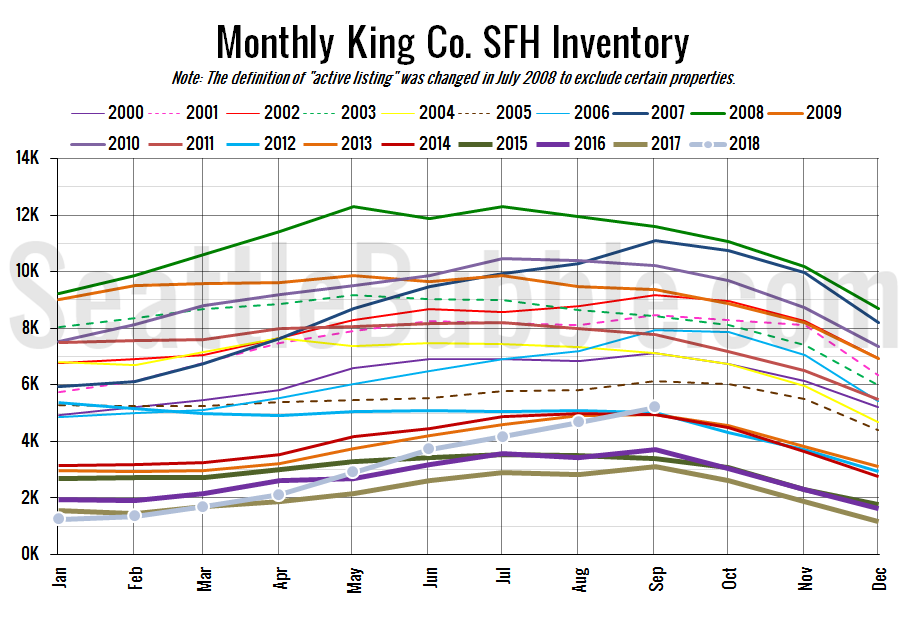
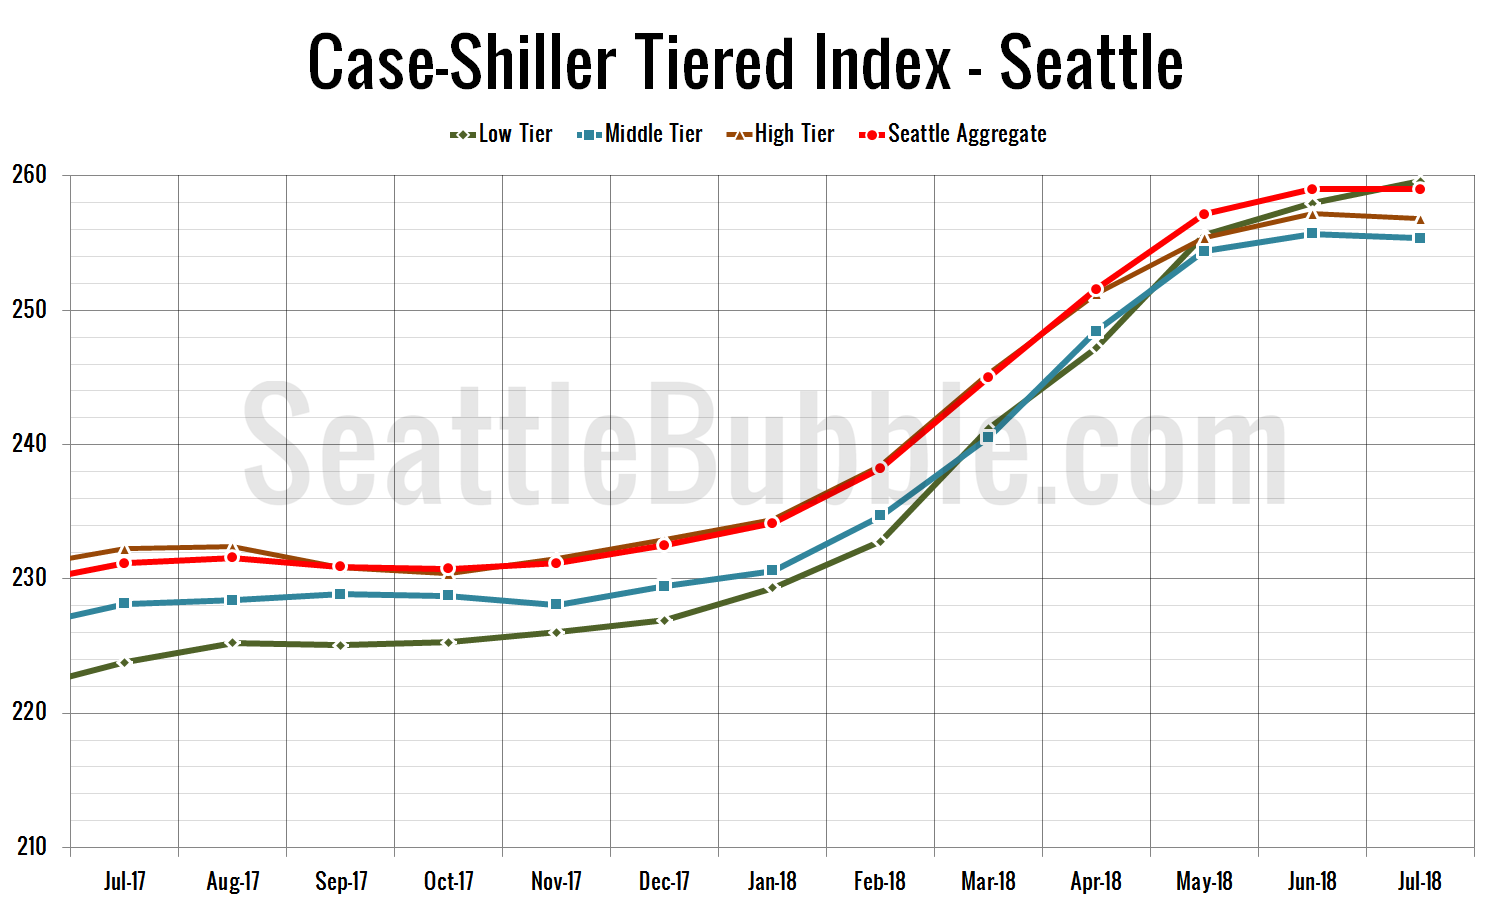
September market stats were published by the NWMLS today. Home prices have leveled off as sales continue to slip and inventory piles up. Year-over-year listing growth hit its highest level ever as the number of homes on the market reached its highest level since January 2012…

Share:

  • Twitter
  • LinkedIn
  • Facebook
  • Reddit
  • Pinterest
  • Email

September Stats Preview: Sales drop over 25 percent from 2017 as listings continue to pile up

Posted on October 1, 2018October 1, 2018 by The Tim

Home sales volume was at its lowest September level in six years for both King and Snohomish County last month, dipping over 22 percent from a year ago. As a result, the number of homes on the market hit its highest point since early 2012. Foreclosures are still at all-time lows…

Share:

  • Twitter
  • LinkedIn
  • Facebook
  • Reddit
  • Pinterest
  • Email

Consumer Confidence blows past 2007 highs, approaches 2000 levels

Posted on September 27, 2018October 1, 2018 by The Tim

Before the month is over, let’s check in in on the latest data from the Consumer Confidence Index.

The overall Consumer Confidence Index currently sits at 138.4, up three percent in a month and up fifteen percent from a year ago…

Share:

  • Twitter
  • LinkedIn
  • Facebook
  • Reddit
  • Pinterest
  • Email

Case-Shiller Tiers: Low tier home prices edged up in July as mid and high tiers slipped

Posted on September 26, 2018October 1, 2018 by The Tim

Let’s check out the three price tiers for the Seattle area, as measured by Case-Shiller. Remember, Case-Shiller’s “Seattle” data is based on single-family home repeat sales in King, Pierce, and Snohomish counties.

Only the low tier was up month-over-month once more in July. The middle tier and high tier both fell…

Share:

  • Twitter
  • LinkedIn
  • Facebook
  • Reddit
  • Pinterest
  • Email

Case-Shiller: Seattle was the only market to see price declines between June and July

Posted on September 25, 2018October 1, 2018 by The Tim

Let’s have a look at the latest data from the Case-Shiller Home Price Index. According to July data that was released today, Seattle-area home prices were:

Down less than 0.1 percent June to July
Up 12.1 percent YOY.
Up 34.7 percent from the July 2007 peak

Last year at this time prices were up 0.7 percent month-over-month and year-over-year prices were up 13.5 percent…

Share:

  • Twitter
  • LinkedIn
  • Facebook
  • Reddit
  • Pinterest
  • Email

Posts navigation

  • Previous
  • 1
  • …
  • 6
  • 7
  • 8
  • 9
  • 10
  • 11
  • 12
  • …
  • 222
  • Next

Tim’s Other Projects

Dispatches from the Multiverse

Tip Jar

Like what we're doing?

Drop us a tip!

Accounts

  • Log in
  • Entries feed
  • Comments feed
  • WordPress.org
©2024 Seattle Bubble | Built using WordPress and Responsive Blogily theme by Superb